TL;DR
This blog explains IFRS 9 impairment calculation, focusing on practical steps to measure expected credit losses under the three-stage model. You’ll learn how to apply credit risk models, including PD, LGD, and EAD estimates, and perform hedge effectiveness testing for compliance. The guide covers key concepts such as forward-looking adjustments and provisioning matrices to manage financial asset impairment accurately. This post equips you with actionable insights to master IFRS 9 impairment calculation and optimize credit risk measurement. Read on to implement effective, defensible impairment strategies confidently.
You’re staring at spreadsheets filled with loan data. You’re trying to figure out how to calculate expected credit losses that satisfy auditors and regulators.
The shift from incurred loss to IFRS 9 impairment calculation has created headaches for finance teams worldwide. The challenge remains the same across all markets. You need accurate, defensible impairment numbers that reflect future credit risk.
In 1Q25, all sampled UK banks either maintained or increased ECL coverage levels, marking the first such occurrence since 4Q22. This global tightening signals regulators aren’t backing down on IFRS 9 impairment calculation requirements.
This guide breaks down IFRS 9 impairment calculation into actionable steps. You’ll find practical methods, real examples, and compliance strategies that work.
Understanding IFRS 9 Impairment Calculation and Its Impact on Global Businesses
IFRS 9 impairment calculation replaced IAS 39 in 2018. It changed how you account for financial instrument impairment completely.
The old incurred loss model waited for credit events to happen. The new one makes you anticipate them before they occur. You recognize expected credit losses from day one, not when trouble becomes obvious.
This affects banks, leasing companies, trade finance firms, and any business extending credit. The principle stays consistent across jurisdictions. You calculate what you expect to lose, not what you’ve already lost.
From 2013 to 2023, adoption of the IFRS 9 ECL model led to a 0.3% increase in the Capital to Assets ratio for Jordanian banks. At the same time, it resulted in a 1.1% decline in the Equity to Assets ratio.
These numbers tell a clear story. Your balance sheet composition changes under IFRS 9 impairment calculation. Capital ratios shift, lending capacity adjusts, and regulatory requirements get recalculated.
The impact varies by jurisdiction and regulatory framework. But the core credit risk measurement framework remains universal across all financial institutions.
The Three-Stage Expected Credit Loss Model for IFRS 9 Impairment Calculation
The staging model categorizes your financial assets based on credit deterioration patterns.
Think of it as a health monitoring system for your portfolio. Stage 1 assets are healthy, Stage 2 shows warning signs, and Stage 3 confirms severe distress. Each stage triggers different measurement requirements and profit-and-loss impacts.
Stage 1: 12-Month Expected Credit Losses
Your financial assets start here at origination under IFRS 9 impairment calculation.
You measure losses that could result from default events within 12 months. This doesn’t mean you only look at 12 months of total losses. You calculate the portion of lifetime losses that would occur if default happened in the next year.
A corporate loan to a AAA-rated company stays in Stage 1 naturally. A trade receivable from a reliable manufacturer with clean payment history remains here. Your client with strong financials and no past due amounts sits comfortably in this category.
Interest revenue gets calculated on the gross carrying amount at this stage. Your impairment provision stays minimal, typically 0.1% to 1% depending on instrument type and borrower quality.
Stage 2: Lifetime Expected Credit Losses Due to Increased Risk
Significant credit deterioration moves assets here under the expected credit loss model.
You now measure lifetime expected losses, not just 12-month projections. The asset hasn’t defaulted, but risk has increased substantially since initial recognition. Understanding IFRS 9 simplified concepts helps you identify these transitions early and accurately.
Payment delays reaching 30 days often trigger Stage 2 classification automatically. But that’s not always required. A one-time delay from a strong borrower might not qualify at all. A pattern of late payments from a weakening borrower definitely does.
Credit rating downgrades matter significantly for IFRS 9 impairment calculation. Your corporate client drops from A to BBB rating. Your textile exporter faces sector-wide challenges affecting their creditworthiness outlook. These signal Stage 2 movement clearly.
Interest revenue still uses gross carrying amount at this level. But your provision jumps significantly, often reaching 5% to 20% of total exposure.
Stage 3: Credit-Impaired Assets and Impairment Recognition
Default has occurred or is virtually certain at this point.
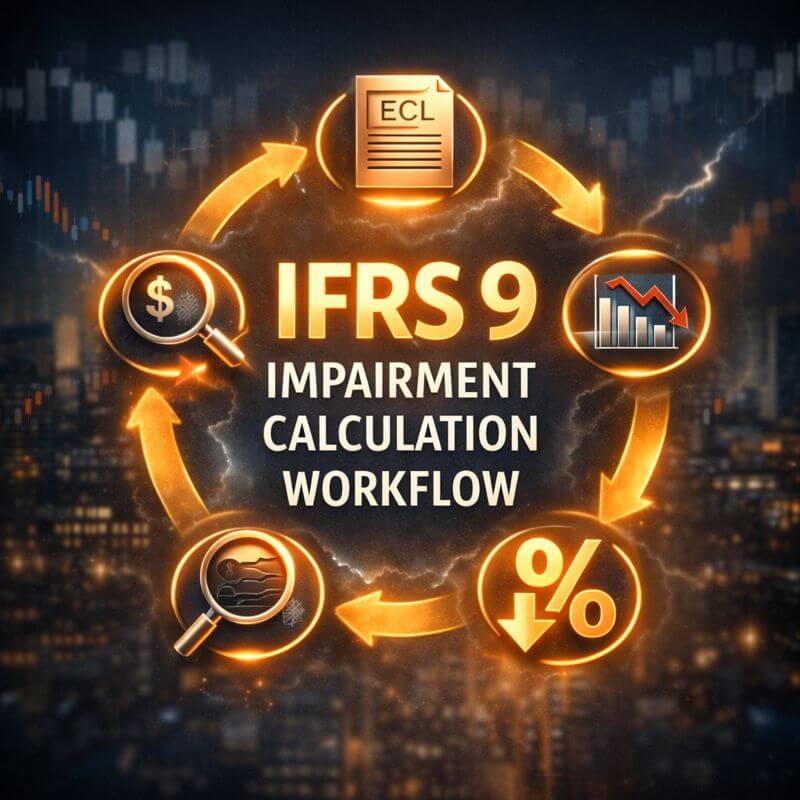
Payments are 90 days past due now. Your borrower filed for bankruptcy proceedings. The manufacturer entered insolvency proceedings. Your counterparty breached loan covenants with no remedy in sight.
Interest revenue switches to net carrying amount—gross minus loss allowance. This prevents overstating revenue on assets that won’t pay in full. In 1Q25, the proportion of UK banks’ Stage 3 loans remained stable as a percentage of total loans and advances.
Your impairment allowance reflects total expected losses under IFRS 9 impairment calculation. It often reaches 50% to 100% depending on collateral and recovery prospects.
How to Calculate Expected Credit Loss Under IFRS 9 Impairment Calculation
IFRS 9 impairment calculation combines three core components into one figure systematically.
The formula works like this: ECL = PD × LGD × EAD. Simple in theory, complex in practice for most organizations. Getting each input right demands data, judgment, and forward-looking adjustments consistently.
ECL Formula: PD × LGD × EAD Explained
Probability of Default (PD) measures likelihood of borrower non-payment accurately.
You calculate this using historical default rates, credit scores, and current economic conditions. A bank might use credit bureau data extensively. A lender taps credit scoring agencies. Institutions rely on credit reporting systems.
For Stage 1, you need 12-month PD calculations. A corporate borrower with strong financials might show 0.5% PD only. For Stage 2, you calculate lifetime PD, which could jump to 5% or significantly higher.
Loss Given Default (LGD) estimates the recovery shortfall after default occurs.
If default happens, how much do you lose after recovering collateral? A secured real estate loan might have 20% LGD. An unsecured trade receivable could hit 80% LGD easily.
Collateral quality matters enormously for IFRS 9 impairment calculation. Property in stable markets protects better than inventory in volatile sectors clearly. Cash deposits offer near-zero LGD. Unsecured exposures to distressed sectors show high LGD.
Exposure at Default (EAD) shows outstanding amount at the default moment.
For term loans, it’s the remaining principal balance. For credit lines, you estimate how much gets drawn before freezing. A fully drawn mortgage has known EAD. A revolving credit facility requires careful estimation.
Data Collection and Management for Accurate ECL Estimates
Quality data drives quality calculations in credit risk models systematically.
You need historical default information covering complete credit cycles comprehensively. Ten years of data beats three years substantially. Economic downturns and recoveries both need representation. From 2013 to 2023, adoption of the IFRS 9 ECL model caused a 3% decrease in the Loans to Assets ratio for Jordanian banks, showing implementation effects clearly.
Your systems must track payment behavior, credit rating changes, covenant breaches comprehensively. Data infrastructure requirements remain consistent, but systems need core tracking elements.
Missing data creates serious problems for IFRS 9 impairment calculation. You can’t calculate PD without default history. You can’t estimate LGD without recovery experience properly. Proxies help initially, but building proprietary data sets improves accuracy over time.
Macroeconomic Forecasting in ECL Models
Forward-looking information separates IFRS 9 from IAS 39 completely.
You adjust ECL calculations for expected economic conditions going forward. GDP forecasts, unemployment rates, commodity prices, interest rates—all feed into credit risk models.
Economic conditions tie closely to credit performance in most sectors. When commodity prices drop, corporate defaults rise and asset values fall. Your expected credit loss model calculations must reflect these correlations properly.
Different markets face different economic drivers clearly. Currency volatility, inflation, and political stability affect credit quality. A depreciating currency hurts importers while helping exporters. Your model needs these nuances.
Business cycles respond to broader economic conditions in predictable patterns. Central bank monetary policy, manufacturing indices, and export demand shape IFRS 9 impairment calculation. A recession forecast increases PD across your entire portfolio.
You typically run multiple scenarios for accuracy: base case, optimistic, pessimistic. Weight them by probability carefully. A 60% base case, 25% pessimistic, and 15% optimistic weighting is common practice.
Simplified vs General Approach to ECL Calculation
IFRS 9 offers two distinct paths for financial asset impairment calculations.
The simplified approach applies to trade receivables, contract assets, and lease receivables. The general approach covers everything else comprehensively.
Most businesses use the simplified approach for customer invoices extensively. You recognize lifetime ECL from day one, skipping Stage 1 assessment. This reduces complexity for high-volume, short-duration receivables significantly.
The general three-stage model applies to loans, debt securities, other financial assets. You track credit deterioration and adjust ECL measurement accordingly. Banks, finance companies, and leasing firms typically follow this path.
Choosing the right approach matters for IFRS 9 impairment calculation. A retailer with thousands of small receivables benefits from simplification. A leasing company with large financings needs the general model’s precision. For more context, exploring differences in IFRS 9 vs IAS 39 clarifies why the standard changed fundamentally.
Key Indicators of Significant Increase in Credit Risk
Spotting credit deterioration early protects your portfolio from unexpected losses.
IFRS 9 doesn’t define “significant increase” precisely or universally. You apply judgment based on quantitative and qualitative factors. Payment status offers the clearest signal. Amounts 30 days past due create rebuttable presumption.
But you can’t rely solely on past due status. Credit rating downgrades matter significantly. A drop of two notches or more often triggers Stage 2.
Covenant breaches signal trouble ahead clearly. Your borrower misses debt service coverage requirements completely. Their leverage ratio exceeds agreed limits. These indicate deteriorating financial health.
Macroeconomic stress in the borrower’s sector or region raises red flags. Commodity price crashes affecting energy companies. Currency devaluation hitting importers hard. Manufacturing slowdown impacting industrial companies.
Watchlist placement by your credit team suggests emerging problems. Restructuring requests indicate financial distress. Management turnover, especially in finance roles, deserves careful scrutiny.
You document these indicators clearly for your expected credit loss model. Auditors and regulators expect consistent application across portfolios. What triggers Stage 2 for one borrower should trigger it for similar situations.
Implementing Forward-Looking Information in IFRS 9 Impairment Calculation
Historical data alone won’t cut it under IFRS 9 requirements.
You incorporate reasonable and supportable information about future conditions systematically. This means economic forecasts, industry outlooks, and market expectations. Working with experienced IFRS 9 advisory firms can accelerate your implementation timeline significantly.
Start with widely available economic forecasts from reputable sources. IMF, World Bank, and central bank projections provide baseline scenarios. Development initiatives affect multiple sectors. Program conditions influence economic trajectory. Energy transitions impact industrial credit quality.
Translate macro variables into credit parameters for IFRS 9 impairment calculation. If GDP falls 2%, how do PD and LGD change? You build regression models using historical relationships carefully. A 1% GDP decline might increase corporate PD by 15 basis points.
Weight multiple scenarios properly for accurate credit risk measurement. Your base case reflects most likely outcomes. Pessimistic scenarios stress test the portfolio. Optimistic cases prevent over-provisioning.
Update forecasts regularly to maintain accuracy. Quarterly reassessment catches emerging risks early. In 1Q25, new-to-arrears flows for UK mortgages declined to 2019 levels, showing how conditions shift.
Using Provision Matrices for Impairment Calculation
Provision matrices simplify ECL calculation for high-volume receivables portfolios.
You group receivables by shared risk characteristics systematically. Aging buckets provide the most common segmentation: current, 1-30 days past due, 31-60 days, 61-90 days, over 90 days past due.
Calculate historical loss rates for each bucket carefully. If 2% of receivables 31-60 days past due ultimately default, that’s your baseline rate. Adjust for forward-looking information. Economic downturn expected? Increase those rates accordingly.
A textile exporter’s provision matrix might show these typical rates:
- Current receivables: 0.5% loss rate
- 1-30 days past due: 2% loss rate
- 31-60 days past due: 8% loss rate
- 61-90 days past due: 25% loss rate
- Over 90 days past due: 60% loss rate
Apply these rates to outstanding balances in each bucket systematically. Sum the results together. That’s your ECL allowance for IFRS 9 impairment calculation purposes.
Customer risk profiles matter too for accurate provisioning. You might segment by geography, industry, or credit rating before aging. An automotive supplier treats domestic and export receivables differently. Retailers separate government and private sector customers.
Provision matrices work beautifully for trade receivables and similar assets. They struggle with long-term loans or complex structured products. Know when to switch to more sophisticated approaches.
Effect of IFRS 9 Impairment on Financial Reporting and Disclosures
Your financial statements change significantly under IFRS 9 requirements.
The balance sheet shows higher impairment allowances, especially on initial adoption. In 2024, ECL cover for UK banks fell over each quarter, reaching levels well below those of 2019 at year-end, but adoption years typically see increases.
Income statements show more volatility under IFRS 9 impairment calculation. ECL provisions swing with economic forecasts and portfolio movements. A downgrade to pessimistic scenarios increases provisions immediately. Improved outlooks release them back.
Disclosure requirements expand dramatically under the new standard. You explain staging decisions, model methodologies, and assumption changes. Investors and regulators scrutinize these notes heavily.
Differences Between IAS 39 and IFRS 9 Impairment Models
The conceptual shift runs deep between these two standards.
IAS 39 used incurred loss methodology exclusively. You waited for objective evidence of impairment. A payment default, bankruptcy filing, or significant financial difficulty triggered recognition. This created “too little, too late” provisions.
IFRS 9 uses expected loss methodology instead. You recognize probable losses immediately from origination. This catches problems earlier but increases subjectivity and volatility.
IAS 39 calculated impairment as difference between carrying amount and cash flows. Simple but backward-looking in nature.
IFRS 9 Financial Instruments Explained requires PD, LGD, and EAD estimates with forward adjustments. Complex but theoretically superior. Many organizations turn to specialized IFRS 9 software to manage these calculations efficiently.
The timing difference matters most for financial institutions. Under IAS 39, a portfolio might show zero impairment until defaults materialize. Under IFRS 9, that same portfolio carries provisions from day one.
Practical Examples of IFRS 9 Impairment Calculation
Let’s walk through a corporate loan scenario step by step.
A manufacturing company borrows 10 million for five years initially. Initial credit rating: BBB. No past due amounts at origination.
Stage 1 IFRS 9 impairment calculation shows:
- 12-month PD: 0.8%
- LGD: 40% secured by equipment
- EAD: 10 million
- ECL = 0.8% × 40% × 10 million = 32,000
Year two brings sector challenges and credit deterioration. Credit rating drops to BB. Payments delayed 35 days. Move to Stage 2.
Stage 2 calculation shows:
- Lifetime PD: 8%
- LGD: 45% as equipment value declines
- EAD: 9.2 million after year one payments
- ECL = 8% × 45% × 9.2 million = 331,200
The provision jumps from 32,000 to 331,200 immediately. Your profit and loss takes a 299,200 hit from financial asset impairment.
Now consider a trade receivable example. A customer owes 50,000. Invoice date: 60 days ago. Payment terms: 30 days net.
Using your provision matrix:
- 31-60 days past due segment
- Historical loss rate: 7%
- Forward adjustment for economic slowdown: +2%
- Adjusted loss rate: 9%
- ECL = 9% × 50,000 = 4,500
You book 4,500 impairment immediately under IFRS 9.
Challenges and Best Practices in IFRS 9 Implementation
Implementation isn’t plug and play for most organizations.
Data gaps create the biggest headache initially. You need years of default history, but new products lack it. You borrow data from similar products or external benchmarks. Document these choices thoroughly for auditors.
Model validation takes time and expertise. Your IFRS 9 impairment calculation needs back-testing. Do predicted losses match actual outcomes? Adjust methodologies when they don’t align.
System integration causes operational headaches. Your loan origination, accounting, and risk management systems must communicate. IFRS advisory services can bridge these technical gaps effectively.
Governance matters enormously for credit risk measurement. Who decides when credit risk increases significantly? Who approves economic scenarios? Who reviews staging decisions? Clear ownership prevents arguments with auditors later.
Common Mistakes to Avoid in IFRS 9 Compliance
Don’t use static models for IFRS 9 impairment calculation.
Your PD, LGD, and EAD estimates must update with new information. Annual recalibration at minimum. Quarterly is better for material portfolios.
Don’t ignore qualitative factors in your assessment.
Payment status and credit ratings matter, but so do industry trends. Management quality and business model sustainability provide important signals. Purely quantitative approaches miss important red flags.
Don’t over-complicate small portfolios unnecessarily.
A company with 5 million in receivables doesn’t need Monte Carlo simulations. A provision matrix works fine. Save sophisticated modeling for material, complex exposures.
Don’t forget contract assets in your scope.
Unbilled work-in-progress under contracts falls under IFRS 9: financial instruments scope. Many companies miss this, creating audit findings.
Don’t treat all 30-day delays identically across borrowers.
The rebuttable presumption means you can argue a delay doesn’t signal increase. A strong borrower with one-time administrative delay differs from struggling clients. Context matters for proper hedge effectiveness testing and staging.
Preparing for the 2025 Prudential Filter Deadline: Compliance Tips
Regulatory deadlines loom large for financial institutions globally.

The prudential filter affects how ECL provisions impact regulatory capital ratios. Different jurisdictions implement it differently across regions. European banks follow EBA guidelines. Regulators issue local interpretations. Institutions answer to central bank rules.
Start preparation now for smooth implementation. Map your current IFRS 9 impairment calculation methodology against regulatory expectations. Identify gaps early. Many institutions find their Stage 2 criteria don’t match supervisory expectations.
Test your models under stress scenarios thoroughly. Regulators want to see how ECL provisions respond to severe shocks. Can your systems handle a 5% GDP decline? A 30% property value drop? A 25% currency devaluation?
Document everything for regulatory reviews. Model development, assumption setting, override decisions, and scenario selections all need justification. When regulators ask why you classified a loan in Stage 2, you need answers.
Train your team thoroughly on new requirements. Portfolio managers need to know staging triggers. Controllers must understand calculation mechanics. Treasury teams should know capital implications.
Run parallel calculations before going live with new systems. Process several months of production data through your ECL framework. This reveals data issues, system bugs, and methodology problems early.
Don’t underestimate the change management aspect of implementation. IFRS 9 impairment calculation affects lending decisions, pricing strategies, product design. Your front office needs to understand how new originations impact ECL.
Implementing IFRS 9 Impairment Calculation Successfully
You’ve learned the three-stage model, ECL formula components, practical calculation approaches.
The staging criteria, forward-looking adjustments, and disclosure requirements now make sense. IFRS 9 impairment calculation demands precision, judgment, and robust systems working together seamlessly.
Start with your highest-risk portfolios for maximum impact. Get ECL calculations right for major exposures before tackling smaller ones. Build provision matrices for trade receivables while developing sophisticated models.
In 1Q25, UK banks’ ECL cover increased by 1 basis point compared to 4Q24, ending a trend of reductions since 2Q23. Active management matters for maintaining compliance.
Prima Consulting helps financial institutions implement IFRS 9 successfully across markets. Our team brings practical experience building ECL models that work. We train teams that understand them. We document approaches that satisfy auditors. Ready to master IFRS 9 impairment calculation? Contact Prima Consulting today.