TL;DR
The IFRS 9 expected credit loss model requires you to estimate losses on financial assets before they occur – using a three-stage framework based on credit deterioration. This guide walks through the ECL formula (PD x LGD x EAD), worked calculation examples for Stage 1, 2, and 3, and what triggers movement between stages. You’ll also find a free downloadable Excel template pre-built for banks and corporates in UAE, Saudi Arabia, and Pakistan.
If you need to calculate expected credit losses under IFRS 9 and you’re staring at the three stages wondering where to start – this is the right place.
The ECL model requires you to estimate credit losses before they happen. Not after a borrower misses a payment. Before. That shift from the old IAS 39 incurred-loss approach is what makes IFRS 9 genuinely difficult to implement, especially when you’re working with trade receivables, term loans, or intercompany balances across markets like UAE, Saudi Arabia, or Pakistan.
This article walks you through the full three-stage ECL framework: what triggers each stage, how to run the calculation, and where most finance teams get it wrong. You’ll also find a free downloadable Excel template pre-built for Stage 1, 2, and 3 provisioning.
For more on how IFRS 9 replaced IAS 39, that page covers the full transition history.
How to Calculate Expected Credit Loss: The ECL Formula with Worked Examples
Before anything else, here’s the formula. This is what Google is looking for, what auditors check, and what every IFRS 9 implementation starts from.
ECL = PD x LGD x EAD
- PD (Probability of Default): The likelihood this borrower fails to pay, expressed as a percentage.
- LGD (Loss Given Default): How much you actually lose if they do default, after any recovery or collateral realization.
- EAD (Exposure at Default): The total outstanding balance at the point of default.
Worked Example – Stage 1 (UAE corporate loan):
- Outstanding balance: AED 2,000,000
- 12-month PD: 1.5%
- LGD: 40%
- ECL = 0.015 x 0.40 x 2,000,000 = AED 12,000
This AED 12,000 goes into your 12-month ECL provision under Stage 1. No significant credit deterioration has occurred, so you only book the 12-month loss estimate – not lifetime.
If that same borrower deteriorates significantly (Stage 2), you switch to lifetime ECL. Same formula, but PD becomes the probability of default over the full remaining loan life. The provision can jump 3x to 5x on a single facility overnight.
For organizations requiring more sophisticated ECL modeling and derivative pricing solutions, the methodology varies based on asset type and available data quality.
What Is the Expected Credit Loss IFRS 9 Framework?
The expected credit loss IFRS 9 model represents a fundamental shift from reactive to proactive credit risk management. This accounting standard requires financial institutions to recognize credit losses before they occur.
Unlike the previous IAS 39 incurred loss model, the expected credit loss IFRS 9 framework demands forward-looking estimates. Banks must now consider historical data, current market conditions, and future economic scenarios when calculating provisions.
The ECL model applies to all financial assets measured at amortized cost. This includes loans, trade receivables, debt securities, and off-balance sheet commitments like loan guarantees.
The financial impact is real. IFRS 9 adoption led Jordanian banks to increase their capital-to-assets ratio by 0.3%, reduce equity ratios by 1.14%, and cut loan-to-assets ratios by 2.91% – demonstrating the standard’s conservative capital management requirements.
IFRS 9 Stage 1, 2 and 3: What Triggers Each Stage and What It Costs You
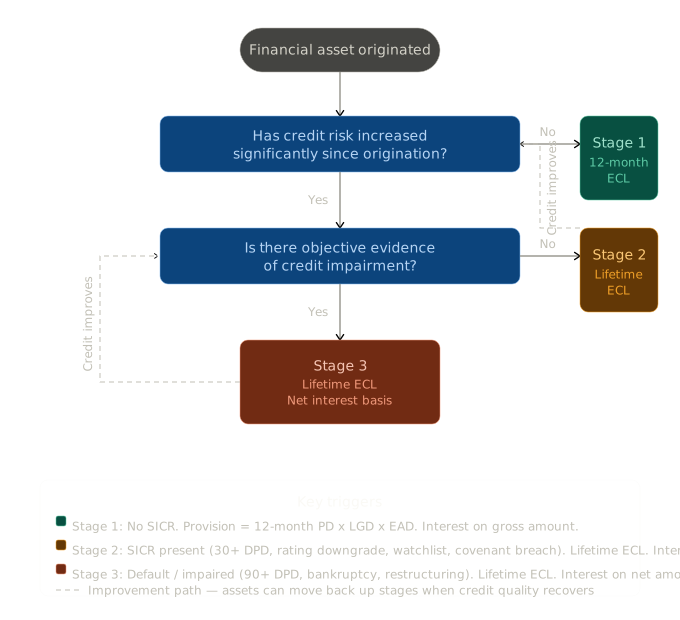
The staging framework forms the backbone of expected credit loss IFRS 9 implementation. Each stage reflects different levels of credit deterioration and triggers specific provisioning requirements.
| Stage | Trigger | ECL Measurement | Interest Recognition |
|---|---|---|---|
| Stage 1 | No significant credit deterioration since origination | 12-month ECL only | Gross carrying amount |
| Stage 2 | Significant increase in credit risk (not yet impaired) | Lifetime ECL | Gross carrying amount |
| Stage 3 | Credit-impaired (objective evidence of default) | Lifetime ECL | Net carrying amount (gross minus provision) |
The jump from Stage 1 to Stage 2 is where most provisioning volatility happens – and where regulators focus hardest during audits.
Stage 1 – 12-Month Expected Credit Losses
Stage 1 captures performing assets with no significant increase in credit risk since initial recognition. These assets maintain their original credit quality.
Banks recognize 12-month ECL for Stage 1 assets. This represents expected losses from default events within the next 12 months – not total losses if a default actually happens.
Interest income calculation uses the gross carrying amount. Banks calculate interest revenue before deducting loss allowances.
Typical Stage 1 assets include new loans with strong credit profiles, trade receivables from established customers, investment-grade debt securities, and performing mortgage portfolios.
Full example: A bank issues a $100,000 five-year loan to a creditworthy borrower. The 12-month PD is 0.5% and LGD is 40%. First Stage ECL = $100,000 x 0.5% x 40% = $200.
Stage 2 – Lifetime ECL for Significant Credit Risk Increase
Applies when credit risk increases significantly since initial recognition. Assets remain performing but show deteriorating credit quality.
The significant increase in credit risk (SICR) triggers lifetime ECL recognition. This captures all expected losses over the asset’s remaining life – not just 12 months.
Interest income still calculates on the gross carrying amount. Banks don’t reduce interest revenue despite higher provisioning requirements.
The 30-day past due backstop provides a rebuttable presumption for SICR. Banks can overcome this presumption with reasonable and supportable information.
Continuing the example: If the borrower’s credit rating drops significantly, moving the loan to Stage 2, the lifetime PD increases to 8%. Lifetime ECL = $100,000 x 8% x 40% = $3,200.
Stage 3 – Lifetime ECL for Credit-Impaired Financial Assets
Stage 3 addresses credit-impaired assets with objective evidence of impairment. These assets have experienced one or more loss events affecting future cash flows.
Banks recognize lifetime ECL for Stage 3 assets. The impairment calculation captures all expected losses over the asset’s remaining life.
Interest income calculates on the net carrying amount – gross amount minus loss allowances. This reflects the deteriorated asset quality and reduces revenue recognition. That’s the key accounting difference from Stage 2.
Credit-impaired indicators include significant financial difficulty of the borrower, breach of contract or default, restructuring due to financial difficulties, and bankruptcy or financial reorganization.
A loan enters Stage 3 when payments are 90+ days past due. This creates a rebuttable presumption of credit impairment.
Completing the example: The borrower defaults and the loan moves to Stage 3. Lifetime PD = 100% (certain default). ECL = $100,000 x 100% x 40% = $40,000. Interest is now calculated on the net carrying amount: $100,000 – $40,000 = $60,000.
Prima Consulting
Building an IFRS 9 ECL model? Our advisory team is available for a free initial consultation.
No obligation · Responds within 1 business day · GCC, Europe & APAC
What Counts as a Significant Increase in Credit Risk?
IFRS 9 doesn’t give you a single number. It expects judgment. But auditors and regulators expect you to document your SICR criteria explicitly before year-end.
Common SICR triggers used by GCC and South Asian banks:
- 30+ days past due (mandatory backstop rule under IFRS 9 – you can’t argue your way out of this one)
- Internal credit rating downgrade of 2 or more notches
- Borrower placed on watchlist by credit risk committee
- Sector-wide macroeconomic stress – for example, an oil price drop affecting UAE corporate exposures
- Covenant breach without waiver
- Reduction in facility limits by the bank reflecting increased credit concern
If any of these apply, the asset moves from Stage 1 to Stage 2. Your provision shifts from 12-month to lifetime ECL. On a 5-year term loan, that can triple the provision overnight.
The low credit risk exemption matters here. If an asset has low credit risk at the reporting date – investment grade or equivalent – you can apply a practical expedient and skip the full SICR assessment. Most banks use this for their high-grade bond portfolios. Whether it applies to your context is worth verifying with your auditor.
For a deeper look at the IFRS 9 impairment calculation methodology including accounting entries, that page covers the balance sheet treatment in detail.
Expected Credit Loss IFRS 9 Measurement Principles
ECL measurement relies on three principles that distinguish it from previous impairment models. These principles maintain consistent application across different financial institutions and asset types.
Forward-Looking Information in ECL Estimates
The expected credit loss IFRS 9 framework requires incorporation of forward-looking estimates without undue cost or effort. Banks must consider past events, current conditions, and forecasts of future economic conditions.
Macroeconomic factors drive ECL calculations significantly. Common forward-looking variables include GDP growth rates, unemployment levels, interest rate forecasts, and industry-specific indicators.
Banks typically develop multiple economic scenarios when implementing IFRS 9 financial instruments requirements. A common approach uses three scenarios: base case (50% weight), optimistic (25% weight), and pessimistic (25% weight).
European Central Bank data shows average provisions for performing IFRS 9 loans are higher than comparable loans under prior national GAAP. What’s interesting is that provisioning behavior varies by banks’ capital headroom – demonstrating the forward-looking approach’s conservative impact.

Using Probability-Weighted Outcomes
ECL calculations must reflect unbiased probability-weighted amounts. Banks can’t simply use the most likely outcome – they must consider all possible scenarios.
The probability-weighted approach prevents management bias. It ensures provisions reflect the full range of possible outcomes rather than optimistic single-point estimates.
A bank evaluates a loan portfolio under three scenarios:
- Scenario A (60% probability): ECL = $50,000
- Scenario B (30% probability): ECL = $75,000
- Scenario C (10% probability): ECL = $150,000
Probability-weighted ECL = ($50,000 x 60%) + ($75,000 x 30%) + ($150,000 x 10%) = $67,500.
Incorporating the Time Value of Money
ECL calculations must consider the time value of money when the effect is material. Banks discount expected cash shortfalls to present value using the asset’s original effective interest rate.
Losses occurring further in the future have less present value impact. This aligns ECL measurement with other financial reporting concepts.
The discounting requirement applies to all ECL measurements, whether 12-month or lifetime. Banks must discount expected cash flows using the original effective interest rate for fixed-rate assets or current effective interest rate for variable-rate assets.
Who Prima works with
Across industries and geographies — delivering measurable outcomes
🏦
Banks & Financial Institutions
IFRS 9 ECL models, credit risk, impairment methodology, regulatory reporting
🛡️
Insurance & Takaful Companies
IFRS 17 implementation, actuarial modelling, GMM/VFA/PAA, CSM calculations
🏢
Corporates & Multinationals
IFRS 15, 16, IAS 36 compliance, financial statements, internal controls
📈
Investment & Asset Managers
IFRS 9 classification, fair value (IFRS 13), derivative valuations, hedge accounting
🏗️
Real Estate & Construction
IFRS 16 lease accounting, IFRS 15 revenue recognition, project-based reporting
🏛️
Family Offices & Holding Groups
Governance frameworks, board advisory, risk management, portfolio evaluation
Step-by-Step ECL Calculation with Full Portfolio Example
ECL calculations combine quantitative models with qualitative adjustments. Here’s a complete worked example for a commercial loan portfolio:
Sample ECL Calculation Template
Portfolio Details:
- Outstanding balance: $10 million
- Average remaining maturity: 3 years
- Current stage: Stage 1
- Original effective interest rate: 6%
Step 1: Determine PD, LGD, and EAD
- 12-month PD: 1.2%
- Lifetime PD: 4.8%
- LGD: 45%
- EAD: $10 million (full exposure)
2: Calculate undiscounted ECL
Stage 1 ECL = $10M x 1.2% x 45% = $54,000
3: Apply discounting (if material)
Discounted ECL = $54,000 / (1.06)^1.5 = $49,091
4: Apply scenario weighting
- Base case (70%): $49,091
- Optimistic (20%): $35,000
- Pessimistic (10%): $85,000
Final ECL = ($49,091 x 70%) + ($35,000 x 20%) + ($85,000 x 10%) = $50,864
For trade receivables, many companies use the simplified approach with loss rates:
Trade Receivables Example:
- Current: $500,000 (loss rate 0.5%)
- 1-30 days past due: $100,000 (loss rate 2%)
- 31-90 days past due: $50,000 (loss rate 15%)
- 90+ days past due: $25,000 (loss rate 50%)
Total ECL = ($500,000 x 0.5%) + ($100,000 x 2%) + ($50,000 x 15%) + ($25,000 x 50%) = $22,000
ECL Journal Entries in Financial Statements
The accounting treatment varies based on the financial asset’s measurement category:
For amortized cost assets:
Dr. Credit Loss Expense $50,864
Cr. Loss Allowance $50,864
For debt instruments at fair value through OCI:
Dr. Credit Loss Expense $50,864
Cr. Other Comprehensive Income $50,864
Banks present ECL charges in the income statement as impairment losses. The loss allowance appears on the balance sheet as a contra-asset account.
Interest revenue recognition differs by stage:
- Stages 1 and 2: Interest on gross carrying amount
- Stage 3: Interest on net carrying amount (after loss allowances)
What Is the ECL Coverage Ratio?
The ECL coverage ratio measures how much of a bank’s gross loan portfolio is covered by its loss allowance. The formula: ECL coverage ratio = loan loss allowance / gross loans.
A higher ratio signals more conservative provisioning. The 2024 European banking study reports the average coverage ratio for amortized loans fell from 1.40% in 2022 to 1.36% in 2023, showing how provisions evolve as economic conditions and implementation maturity develop.
Regulators use coverage ratios to compare provisioning adequacy across banks. A sharp drop without a corresponding improvement in portfolio quality typically draws scrutiny from the State Bank of Pakistan, UAE Central Bank, and SAMA alike.
Recognition and Measurement of ECL Under IFRS 9
ECL recognition follows specific timing and measurement requirements that differ from traditional impairment approaches.
When to Recognize an ECL Provision
Banks must recognize ECL allowances immediately upon initial recognition of financial assets. This “day-one” provisioning marks a significant departure from incurred loss models.
Recognition triggers include: initial asset recognition, reporting date assessments, significant changes in credit risk, and changes in forward-looking information.
Banks can’t wait for loss events to occur. The expected loss approach requires proactive recognition based on forward-looking assessments.
For purchased or originated credit-impaired (POCI) assets, special rules apply. Banks recognize credit-adjusted effective interest rates and lifetime ECL from the purchase date itself – not from when a loss event occurs. This matters for portfolios acquired through mergers or distressed asset purchases.
Measurement Adjustments Over Time
ECL allowances require ongoing reassessment at each reporting period. Banks must update their provisions based on new information and changing circumstances.
Key reassessment factors include: changes in borrower creditworthiness, updated macroeconomic forecasts, new historical loss experience, and model refinements.
Stage migrations trigger automatic measurement adjustments. A loan moving from Stage 1 to Stage 2 requires lifetime ECL recognition instead of 12-month ECL.
Post-Model Adjustments and Management Overlays
Model-driven ECL results don’t always capture everything. Post-model adjustments (PMAs) – sometimes called management overlays – allow banks to apply judgment-based corrections when the model lacks the data to reflect a known risk.
Examples where PMAs are appropriate: a sudden geopolitical shock affecting specific borrower sectors, a central bank rate move not yet reflected in PD curves, or a concentrated exposure to a troubled industry that historical data doesn’t cover well.
The IFRS Foundation has flagged increased PMA usage during periods of economic uncertainty and has specifically raised concerns about the subjectivity and governance of such adjustments. The risk is real: poorly documented overlays become an audit liability. Every PMA needs a clear link to observable forward-looking data, documented approval authority, and an expected reversal trigger.
Reversal of Impairment Losses
IFRS 9 allows reversal of impairment losses when credit conditions improve. This creates potential earnings volatility as economic conditions change.
Reversal requirements: objective evidence of credit improvement, reversal can’t exceed original asset cost, and Stage 3 assets can move back to Stage 1 or 2.
Banks must document the rationale for reversals. The improvement must be supported by observable data rather than management optimism.
ECL Implementation in UAE, Saudi Arabia, and Pakistan: What’s Different
Regional implementation isn’t uniform. Big 4 guides cover the global standard – they don’t cover what SAMA expects, what SBP inspectors focus on, or how UAE banks treat the Central Bank’s phase-in provisions. That’s where local knowledge matters.
UAE: The Central Bank of the UAE’s Prudential Filter – which allowed banks to add back IFRS 9 transition adjustments to regulatory capital over a phase-in period – expired at end-2024. Full provisioning impact now flows directly through balance sheets. UAE banks typically calibrate their ECL models to macroeconomic variables including Dubai real estate price indices, oil price forecasts, and sector credit outlooks. For non-bank UAE entities, the simplified approach for trade receivables remains the most practical path.
Saudi Arabia: SAMA’s supervisory guidelines require banks to maintain at minimum a base-case, optimistic, and pessimistic ECL scenario – probability-weighted. Non-bank Saudi corporates adopting IFRS 9 frequently use provision matrices for trade receivables under the cost-benefit relief permitted by the standard. Construction and contracting sector exposures receive particular scrutiny given concentration risk. For a broader look at ECL implementation guidance for UAE businesses, that page covers the regional specifics in more depth.
Pakistan: The State Bank of Pakistan’s BPRD Circular No. 4 of 2019 governs IFRS 9 adoption for scheduled banks. Pakistani banks face specific challenges: limited historical default data spanning full credit cycles, concentrated sectoral exposures in textiles and energy, and LGD adjustments required for foreign-currency loans under currency stress scenarios. SBP inspections in 2024-2025 have focused heavily on SICR documentation quality and the robustness of macroeconomic overlays.
Companies in UAE, Saudi Arabia, and Pakistan must also comply with local regulatory requirements alongside IFRS 9. This creates additional complexity for any organization operating across jurisdictions. Including IFRS 9 simplified guidance for non-bank entities who need a lighter-touch starting point.
IFRS 9 Expected Credit Loss: Implementation Challenges
Implementation challenges create significant operational and financial reporting hurdles. Organizations must address these systematically to achieve compliant and effective ECL frameworks.
Data quality represents the primary barrier. ECL calculations require extensive historical information spanning multiple economic cycles.
Common data challenges: insufficient default history, incomplete recovery information, limited macroeconomic data linkage, and poor data governance and controls.
System infrastructure requirements often exceed existing capabilities. Organizations need modeling platforms supporting scenario analysis and probability calculations.
The IFRS Foundation highlights increased use of post-model adjustments (management overlays) during periods of economic uncertainty, expressing concerns about subjectivity and governance of such adjustments. That’s a real audit risk for any institution that treats overlays as a shortcut rather than a documented process.
For organizations evaluating whether to build or buy IFRS 9 ECL software for banks, the build vs. buy decision requires careful evaluation of internal capabilities and resource constraints. Total cost of ownership – including ongoing maintenance and regulatory updates – usually tells a different story than the initial build estimate.
Real-World Impact of IFRS 9 Expected Credit Loss on Financial Reporting
IFRS 9 implementation creates measurable impacts on financial statements and key performance metrics. Banks and other financial institutions report significant changes in provisioning patterns and capital allocation.
Saudi banks experienced notable adjustments during IFRS 9 transition. The standard requires banks to calculate provisioning needs based on expected credit loss instead of waiting for a loss event – and that shift is permanent, not a one-time transition cost.
Volatility in earnings increases due to forward-looking adjustments. Economic forecast changes trigger provision adjustments without corresponding cash flow impacts.
Key financial statement impacts: higher initial provisions upon implementation, increased earnings volatility, earlier loss recognition, and changes in regulatory capital ratios.
The staging approach creates cliff effects. Assets moving between stages experience dramatic provision changes that may not reflect gradual credit deterioration. Boards need to understand this – a single rating downgrade can trigger a provision jump that hits reported profits materially.
For manufacturing and financial sector services organizations implementing comprehensive IFRS 9 compliance, ECL compliance requires robust internal controls and reporting processes that extend beyond traditional accounting functions.
Tips for Managing ECL Compliance Efficiently
Establish Strong Data Governance
Create centralized data repositories supporting ECL calculations. Implement automated data validation and quality controls to ensure accuracy.
Invest in data infrastructure before model development. Poor data quality undermines even sophisticated modeling approaches.
Develop Scalable Model Frameworks
Build models that accommodate multiple asset classes and scenarios. Avoid overly complex approaches that become difficult to maintain and validate.
Consider model hierarchy: simple statistical models for homogeneous portfolios, advanced econometric models for complex exposures, and hybrid approaches for specialized asset classes.
Implement Robust Staging Methodologies
Document clear criteria for significant increase in credit risk determination. Establish quantitative thresholds supported by qualitative indicators.
Create systematic staging review processes. Consistent application across portfolios and reporting periods is what auditors check first.
Streamline Scenario Development
Develop standardized economic scenarios with clear documentation. Link macroeconomic variables to portfolio performance through statistical analysis.
Update scenarios regularly but avoid excessive volatility. Balance responsiveness with earnings stability considerations.
Enhance Model Validation and Controls
Establish three lines of defense for ECL models. Separate model development, validation, and audit functions.
Document all modeling decisions and assumptions. Maintain audit trails supporting provision calculations and management judgments.
Focus on Practical Implementation
Prioritize materiality in model complexity decisions. Avoid over-engineering solutions for immaterial exposures.
Train staff across multiple functions. ECL implementation requires coordination between risk, finance, and business units.

Building Your ECL Model: Where to Start and When to Get Help
If you’re in the early stages – understanding how ECL works and what the standard requires – the free Excel template below is your best starting point. It walks through Stage 1, 2, and 3 provisioning in a structure you can adapt to your own loan book or receivables.
If you’re building a production-grade ECL model – one that needs to pass a regulatory audit, an external validation, or a Big 4 review – the template will only take you so far. The real complexity is in the PD curves, macroeconomic overlays, and stage migration logic.
That’s where our ECL modelling team comes in. We’ve built ECL models for banks and corporates across the UAE, Saudi Arabia, Pakistan, and the broader GCC.
Free Consultation
Ready to discuss your ECL model?
Prima’s advisors work with banks and corporates across the GCC, Europe, and Asia-Pacific. First conversation is always free — no pitch, just expertise.