TL;DR
IFRS 17 actuarial best practices help you build transparent, audit-ready frameworks that transform insurance reporting. This guide covers proven implementation tips, from selecting measurement models and setting discount rates to managing risk margins and automating calculations. You’ll learn how to overcome data challenges, strengthen governance, and align actuarial insights with business strategy. Discover practical methodologies for assumption setting, system integration, and stakeholder collaboration that drive successful IFRS 17 adoption.
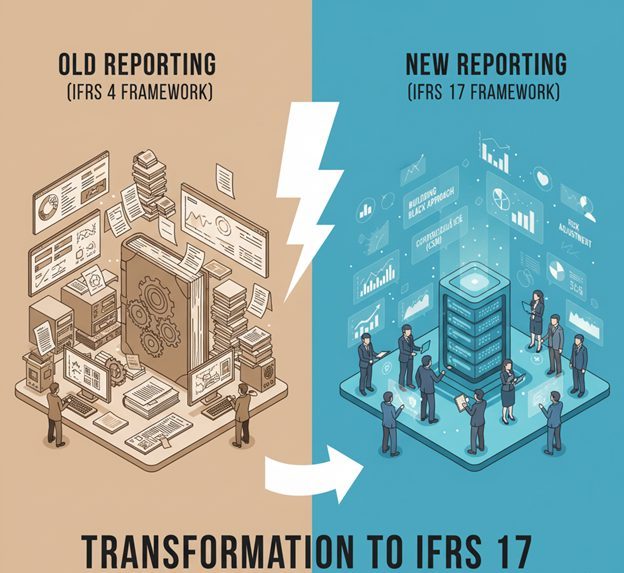
The insurance industry’s undergone a seismic shift since IFRS 17 replaced IFRS 4 in January 2023.
For actuaries worldwide, this isn’t just another accounting standard. It’s a complete transformation of how you measure, report, and think about insurance contracts.
According to PwC’s 2024 Global Insurance Survey, over 80% of insurers reported improved collaboration and integration between finance and actuarial teams as a result of IFRS 17 implementation, emphasizing the central role of actuarial expertise in managing this transformation.”
This guide walks you through proven IFRS 17 actuarial best practices that work in 2026 and beyond. You’ll learn practical implementation strategies, discover how to overcome common challenges, and understand what separates successful implementations from struggling ones.
Whether you’re refining your existing processes or planning your transition, these insights will help you build robust, audit-ready actuarial frameworks.
Understanding IFRS 17 and Its Impact on Actuarial Work
What IFRS 17 means for actuarial teams in 2026 and beyond
IFRS 17 fundamentally changed your role as an actuary.
You’re no longer just calculating reserves and analyzing risk. Today, you’re a central figure in financial reporting, working alongside accountants to produce transparent, market-consistent valuations.
The standard introduced the Contractual Service Margin (CSM), which represents unearned profit in your insurance contracts. Managing this CSM requires sophisticated actuarial modeling and continuous monitoring throughout the contract lifecycle.
Your responsibilities now include building complex cash flow projections, setting discount rates that reflect current market conditions, and quantifying risk adjustments. These tasks demand both technical expertise and business judgment.
Deloitte’s 2024 Actuarial Survey found that 68% of actuaries report spending 40% more time on financial reporting than they did under IFRS 4.
IFRS 17 vs IFRS 4 – Key changes actuaries must know
The shift from IFRS 4 to IFRS 17 represents the most significant change in insurance accounting history.
Under IFRS 4, insurers used various local accounting frameworks with limited consistency. You could apply different measurement bases across different contract types. This flexibility created comparability issues for investors and regulators.
IFRS 17 brought standardization. Every insurance contract now follows consistent measurement principles based on current estimates of future cash flows.
The key differences you need to understand include fundamental changes to profit recognition, discount rate treatment, and risk margin calculation. IFRS 4 allowed grandfathering of existing practices while IFRS 17 requires fresh measurement for all contracts using one of three specific models.
Risk margins under IFRS 4 varied by jurisdiction and often lacked clear methodology. IFRS 17’s risk adjustment must be calculated explicitly and disclosed separately.
Profit recognition changed completely. IFRS 4 often recognized profits at inception while IFRS 17 defers profit recognition through the CSM, releasing it as you provide coverage.
Discount rates under IFRS 4 were often held constant. IFRS 17 requires you to update them regularly, with specific rules about when changes affect profit versus equity.
For more detailed comparison insights, read about IFRS 17 vs IFRS 4 to understand the full scope of these changes.
Core objectives and benefits of IFRS 17 implementation
IFRS 17 aims to improve transparency and comparability across the global insurance industry.
The standard provides investors with clear information about your insurer’s financial position and performance. They can now compare companies across borders without adjusting for different accounting practices.
From an actuarial perspective, IFRS 17 brings several benefits. You’re forced to build more sophisticated models that better reflect economic reality, which improves decision-making beyond just financial reporting.
The standard requires explicit disclosure of key assumptions and methodologies. This transparency builds stakeholder confidence in your work.
Regular updating of assumptions and discount rates means your valuations better reflect current market conditions. You’re no longer locked into outdated assumptions from contract inception.
The focus on current estimates encourages you to invest in better data systems and governance frameworks. These improvements benefit other actuarial functions like pricing and capital management.
According to KPMG’s 2024 Insurance Report, insurers that view IFRS 17 implementation as a business transformation opportunity report 32% higher stakeholder satisfaction than those treating it as pure compliance.
How IFRS 17 transforms insurance contract accounting
IFRS 17 introduced a building-block approach to measuring insurance contracts.
You start with estimates of future cash flows, including premiums, claims, expenses, and any other contractual payments. These estimates must be current, unbiased, and probability-weighted.
Next, you adjust these cash flows for the time value of money using appropriate discount rates. The choice of discount methodology significantly affects your results and requires careful consideration.
Then you add a risk adjustment that reflects the compensation you require for bearing uncertainty about future cash flows. This quantifies the risk you’re taking on behalf of policyholders.
Finally, for contracts expected to be profitable at inception, you calculate the CSM. This represents your unearned profit, which you’ll release systematically as you provide coverage.
The standard requires you to update these measurements at each reporting date. This creates a dynamic, market-responsive valuation framework that better reflects your economic position.
Understanding how IFRS 17 implementation transforms your accounting processes helps you plan resource allocation and system requirements effectively.
Core IFRS 17 Actuarial Best Practices and Models

Key measurement models under IFRS 17
IFRS 17 provides three measurement approaches, each designed for different contract types and circumstances.
Choosing the right model affects your data requirements, system complexity, and financial results. You need to understand when each model applies and what it requires from your actuarial team.
General Measurement Model (GMM) explained
The GMM serves as the default measurement approach for most insurance contracts under IFRS 17.
You’ll use GMM when contracts don’t qualify for simplified approaches or direct participation features. This model requires the most detailed actuarial work and sophisticated systems.
Under GMM, you project all future cash flows for each group of contracts. These projections must include premiums, claims, acquisition costs, ongoing administration expenses, and investment returns.
You then discount these cash flows using rates that reflect the characteristics of the liability. The discount rate methodology you choose significantly impacts your results and requires careful documentation.
Next, you calculate a risk adjustment that quantifies the compensation required for uncertainty. Most insurers use confidence level approaches, typically at the 75th percentile, though practices vary globally.
The CSM calculation captures expected profit at contract inception. You release this profit over the coverage period using coverage units that reflect the pattern of service provision.
EY’s 2024 Implementation Study found that 62% of insurers struggle with GMM data and system challenges, particularly for long-duration contracts with complex features.
Your actuarial model must track the CSM separately from the liability for remaining coverage and the liability for incurred claims. This requires robust systems that can handle detailed movement analyses.
Variable Fee Approach (VFA) considerations
VFA applies to insurance contracts with direct participation features, common in unit-linked and participating business.
Under VFA, policyholders share directly in returns from underlying items. This creates a link between contract value and investment performance that you must reflect in your measurements.
The key difference from GMM is that changes in underlying item values affect the CSM rather than profit and loss. This creates smoother profit recognition that better reflects the economic substance of these contracts.
You need to identify which contracts qualify for VFA based on specific criteria. The contract must provide policyholders with participation in a clearly identified pool of underlying items, and you must expect to pay them a substantial share of returns.
VFA measurement requires you to track changes in the fair value of underlying items and determine how much flows through to policyholders versus shareholders. This split affects both CSM movements and profit recognition patterns.
Your actuarial judgment plays a critical role in determining participation rates and how economic changes affect policyholder values. These decisions require clear documentation and governance approval.
Premium Allocation Approach (PAA) usage
PAA offers a simplified measurement approach for short-duration contracts, typically those with coverage periods of one year or less.
You can apply PAA when the liability measured using PAA wouldn’t differ materially from GMM results. This test requires actuarial analysis to demonstrate immateriality.
Under PAA, you don’t need to project detailed future cash flows or calculate an explicit CSM. Instead, you recognize premiums as revenue systematically over the coverage period.
You measure the liability for remaining coverage as unearned premium, adjusted for acquisition cost deferral if you elect this option. This closely resembles traditional insurance accounting.
Claims are measured at their fulfillment value, similar to GMM. This requires discounting if claims are expected to be paid more than one year after the incurrence date.
Research from the Casualty Actuarial Society shows that 68% of property and casualty insurers use PAA for most contracts, finding it reduces system complexity while maintaining reasonable accuracy.
You still need to perform onerous contract testing at inception and each reporting date. If contracts become loss-making, you must recognize losses immediately through profit and loss.
PAA doesn’t eliminate actuarial work. You still need robust processes for claims estimation, expense allocation, and assumption-setting that meet audit requirements.
Contract boundaries and actuarial cash flow projections
Determining contract boundaries is one of the most critical actuarial judgments under IFRS 17.
The boundary defines which cash flows belong to the contract and which lie outside it. This affects your liability measurement, profit recognition timing, and CSM calculation.
A contract boundary exists at the point where you have the practical ability to reassess risk and can set pricing that reflects that risk. Beyond this point, cash flows don’t belong to the existing contract.
For many property and casualty contracts, boundaries align with coverage periods because you can reprice at each renewal. For long-duration life insurance, boundaries often extend to contract maturity because pricing is fixed.
Your cash flow projections must include all amounts within the boundary that you expect to pay or receive. This includes direct costs like claims and benefits, as well as allocated expenses for administration and investment management.
You need to model policyholder behavior explicitly. Lapse, surrender, and option exercise rates significantly affect your cash flow patterns and timing.
According to Swiss Re’s 2024 Technical Paper, actuarial modeling of policyholder behavior represents one of the most subjective areas of IFRS 17, with significant variation in practices across markets.
Your projections must be unbiased and probability-weighted. This means considering multiple scenarios rather than using single best estimates. For material options or guarantees, stochastic modeling may be necessary.
Selecting discount rates under IFRS 17 actuarial best practices
Discount rate methodology is arguably the most impactful actuarial choice you’ll make under IFRS 17.
The standard allows either a bottom-up or top-down approach, and your choice affects results, volatility, and complexity.
Bottom-up vs top-down approaches
The bottom-up approach starts with a risk-free yield curve and adds an illiquidity premium.
You build the risk-free curve using government bond rates or swap rates, depending on your jurisdiction and availability of deep, liquid markets. This provides the foundation for time value of money.
Determining the illiquidity premium
The illiquidity premium compensates for the fact that insurance liabilities can’t be traded like financial instruments. You can include this premium only if liability cash flows don’t vary with asset returns.
Calculating the illiquidity premium requires significant actuarial judgment. Most insurers reference credit spreads on high-quality corporate bonds, adjusting for expected credit losses.
Understanding the top-down method
The top-down approach starts with actual asset portfolio yields and removes components that don’t reflect liability characteristics.
You subtract expected credit losses, risk premiums for asset-specific risks, and any mismatches between asset and liability features. What remains should reflect the characteristics of the insurance liability.
Industry practices and consistency requirements
Oliver Wyman’s 2024 Analysis found that 65% of insurers use bottom-up approaches, citing easier auditability and reduced sensitivity to asset mix changes.
Your chosen approach must be applied consistently across all contracts with similar characteristics. You can’t switch between methods to manage results.
Managing risk margins and volatility impacts
Risk margins under IFRS 17 quantify the compensation you require for bearing non-financial risk uncertainty.
The standard doesn’t prescribe a specific methodology, but your approach must meet explicit principles. The risk adjustment must reflect the degree of risk and your risk preferences.
Choosing your methodology
Most insurers use confidence level approaches, calculating the difference between a best estimate and a specified percentile of the outcome distribution. Common confidence levels range from 70th to 90th percentile.
Some use cost-of-capital methods, calculating the present value of capital needed to support non-financial risks over the contract duration.
Impact on volatility and business alignment
Your risk adjustment methodology significantly affects balance sheet volatility. Higher risk adjustments create larger buffers against adverse experience but also impact profit recognition timing.
You need to calibrate your risk adjustment approach to reflect your actual risk tolerance and be consistent with how you make business decisions. Disconnects between IFRS 17 risk adjustments and internal risk management create confusion.
Industry benchmarks and disclosure requirements
According to Moody’s 2024 Insurance Report, risk adjustment methodologies vary widely across insurers, with resulting values ranging from 2% to 15% of liabilities for similar portfolios.
You must disclose your confidence level or equivalent information, making your risk adjustment approach transparent to users of your financial statements.
Implementing confidence level approaches
For confidence level approaches, you start by identifying the key sources of non-financial risk. These typically include mortality and morbidity risk, expense risk, lapse risk, and catastrophe risk.
You then model the distribution of outcomes for each risk source. This often involves stochastic modeling for material risks, with simplified approaches for immaterial ones.
Aggregation across risk types requires consideration of diversification effects. Risks don’t all materialize at once, so your total risk adjustment should reflect the benefits of diversification within your portfolio.
Applying cost-of-capital methods
Cost-of-capital methods require you to determine the amount of capital needed to support each risk type and the cost of holding that capital over time. You then discount these costs to get a present value risk adjustment.
Willis Towers Watson’s 2024 Study found that 72% of insurers using cost-of-capital methods set their capital levels by reference to regulatory solvency requirements rather
than economic capital models.
Documentation and testing requirements
Your calculations must be documented thoroughly. Auditors scrutinize risk adjustment methodologies carefully, and you need to demonstrate that your approach meets IFRS 17 principles.
Sensitivity testing is critical. You should understand how your risk adjustment responds to changes in portfolio mix, market conditions, and calibration parameters. This helps you explain movements to stakeholders.
For insights into managing complex actuarial assumptions throughout implementation, explore resources on IFRS 17 actuarial assumptions.
Data and Systems Essentials for IFRS 17 Compliance
Data requirements for IFRS 17 actuarial modeling
IFRS 17 dramatically increased the volume and granularity of data you need for actuarial modeling.
Unlike IFRS 4, which often allowed aggregate calculations, IFRS 17 requires contract-level or cohort-level tracking throughout the entire contract lifetime. This creates significant data management challenges.
You need historical data stretching back to contract inception for transition calculations. For long-duration life insurance, this means accessing records from decades ago, which many systems didn’t preserve in usable formats.
Going forward, you must capture and retain detailed information about every contract you issue. This includes premium patterns, coverage levels, embedded options, policyholder characteristics, and any features that affect cash flows.
Your data must support analysis of change requirements. You need to explain movements in your insurance liabilities between reporting dates, attributing changes to specific drivers like new business, existing business changes, and assumption updates.
According to Accenture’s 2024 Insurance Technology Report, 90% of insurers lack end-to-end actuarial automation, with data quality and availability cited as the primary obstacle.
You also need market data for discount curve construction and assumption-setting. Interest rates, credit spreads, inflation indices, and mortality tables must be current and auditable.
Data governance becomes paramount. You need clear ownership, defined quality standards, and documented processes for data collection, validation, and storage.
Best practices for actuarial data governance and quality
Building robust data governance isn’t optional under IFRS 17. It’s a regulatory and audit requirement.
Your data governance framework should define roles and responsibilities clearly. Who owns each data element? Who’s responsible for quality? Who approves changes?
Storage, treatment, and validation standards
Data storage for IFRS 17 must balance accessibility with security and auditability.
You need systems that can store contract-level detail indefinitely while remaining performant as data volumes grow. Many insurers underestimated storage requirements during initial implementation.
Your storage architecture should support version control. You need to recreate previous valuations exactly, which means preserving not just data but also the assumptions and methodologies used.
Data treatment protocols must be documented comprehensively. How do you handle missing values? What defaults apply when specific contract features aren’t captured? How do you allocate expenses to contract groups?
Validation processes should operate at multiple levels. Automated checks catch obvious errors like negative ages or future-dated historical transactions. More sophisticated analytics identify unusual patterns that warrant investigation.
Gartner’s 2024 Data Management Research recommends three-tier validation: automated rule-based checks, statistical anomaly detection, and expert review of material items.
Your validation framework should include reconciliation between actuarial and accounting systems. Discrepancies often reveal data quality issues or misunderstandings about contract terms.
Documentation of data quality issues and their resolution creates an audit trail. You need to show that you identified problems and took appropriate corrective actions.
Ensuring audit-ready and traceable data
Audit readiness means auditors can verify your data’s accuracy and completeness without spending weeks chasing documentation.
You need clear lineage from source systems through transformations to final actuarial models. Every adjustment or calculation should be traceable back to its inputs.
Metadata management is critical. You should be able to quickly identify when data was created, who created it, what sources it came from, and what transformations were applied.
Access controls prevent unauthorized changes while ensuring appropriate people can perform their roles. Your governance framework should define who can read, modify, or approve different data elements.
Change logs track all modifications to data, systems, or processes. When auditors ask why a number changed, you need to provide clear, documented explanations.
Testing environments separate from production systems let you validate changes before implementation. This prevents errors from reaching your financial statements.
According to PwC’s 2024 IFRS 17 Survey, insurers with mature data governance frameworks complete audits 45% faster than those with ad-hoc processes.
Systems integration and architecture for IFRS 17 readiness
Your technology architecture determines whether IFRS 17 implementation succeeds or becomes an ongoing struggle.
Many insurers initially underinvested in systems, thinking they could manage with spreadsheets or minimal enhancements. They quickly discovered this approach doesn’t scale.
Building scalable actuarial systems
Scalability means your systems handle growing data volumes, increasing complexity, and additional reporting requirements without constant rework.
You need actuarial engines that can process millions of contracts efficiently. Manual calculations or spreadsheet-based processes break down as volumes grow beyond a few thousand contracts.
Your architecture should separate data, calculation logic, and reporting. This modular design lets you update components independently rather than rebuilding everything when requirements change.
Calculation engines must support parallel processing. IFRS 17 valuations involve many independent calculations that can run simultaneously, dramatically reducing run times.
Version control for models and assumptions ensures consistency and traceability. You need to know exactly which model version produced each set of results.
Forrester’s 2024 Insurance Systems Report found that insurers using modern, purpose-built IFRS 17 systems complete monthly closes 60% faster than those using legacy systems with custom modifications.
Cloud-based infrastructure provides flexibility to scale computing resources up or down based on period-end demands. This reduces costs compared to maintaining on-premises capacity for peak loads.
Your system should support scenario analysis and assumption testing. You need to quickly understand how changes in key assumptions affect your results.
Ensuring compatibility with finance and risk tools
IFRS 17 creates new requirements for coordination between actuarial, finance, and risk management systems.
Your actuarial calculations feed into financial consolidation and reporting systems. Data must flow smoothly without manual intervention or reconciliation breaks.
Integration with general ledger systems ensures consistency between actuarial and accounting views. Discrepancies create confusion and audit issues.
Risk management systems need access to IFRS 17 data for capital allocation, pricing decisions, and strategic planning. Siloed systems that don’t communicate create inefficiency and inconsistency.
Your architecture should support multiple reporting frameworks simultaneously. Most insurers need IFRS 17, local GAAP, and regulatory reporting, often with shared data and assumptions.
API-based integration provides flexibility as systems evolve. Point-to-point integrations become unmanageable as the number of systems grows.
Data warehouses or data lakes centralize information from multiple sources. This single source of truth reduces reconciliation efforts and improves data quality.
According to Celent’s 2024 Insurance Technology Analysis, insurers with integrated technology ecosystems report 40% fewer data quality issues than those with fragmented systems.
For comprehensive insights on system selection and implementation, review information about IFRS 17 compliance systems.
Managing data complexity and integration challenges
Even with good architecture, data complexity remains a significant challenge under IFRS 17.
You’re dealing with diverse contract types, each with unique features and cash flow patterns. Your data model must accommodate this diversity without becoming unmanageably complex.
Contract modifications and riders add layers of complexity. You need to track original terms, all modifications, and their effective dates to properly determine measurement.
Reinsurance adds another dimension. You must track gross and net positions separately, with detailed information about reinsurance contract terms and how they affect your retained risk.
Historical data often exists in multiple formats across various legacy systems. Standardizing and consolidating this information while preserving accuracy requires significant effort.
You’ll encounter missing or incomplete data, especially for older contracts. Your processes must define how to handle these gaps consistently and defensibly.
Cross-border operations introduce additional complexity. Different jurisdictions may have different data capture requirements, creating inconsistencies you need to resolve.
McKinsey’s 2024 Insurance Report found that data challenges consumed 35% of total IFRS 17 implementation effort, more than any other single activity.
Regular data quality reviews identify emerging issues before they affect financial reporting. These reviews should involve both technical data specialists and business experts who understand contract terms.
Investment in master data management pays dividends beyond IFRS 17. Better data quality improves pricing, risk management, and customer service across your organization.
Governance, Controls, and Validation in IFRS 17

Building a strong governance framework for IFRS 17 actuarial processes
Governance failures are the most common reason IFRS 17 implementations struggle or fail outright.
You need clear decision-making processes, defined responsibilities, and effective oversight. Without these, even technically sound actuarial work won’t meet stakeholder expectations.
Your governance structure should include a steering committee with representation from actuarial, finance, IT, and senior management. This committee makes key decisions about methodologies, resources, and priorities.
Technical working groups handle detailed methodology development and implementation. These groups need sufficient authority to make technical decisions while escalating material issues to the steering committee.
Clear accountability means every significant assumption, methodology choice, and system decision has an identified owner. This person is responsible for documentation, implementation, and ongoing monitoring.
Regular reporting to senior management and the board keeps them informed about progress, challenges, and resource needs. Surprises at financial statement release time indicate governance failures.
Your governance framework should define materiality thresholds. Not every decision requires board approval, but material judgments need appropriate oversight.
According to KPMG’s 2024 Governance Study, insurers with strong governance committees resolved implementation challenges 50% faster than those without formal structures.
Documentation of governance decisions creates an audit trail. You should be able to show who made decisions, when they were made, what alternatives were considered, and why the chosen approach was selected.
Internal control structures and oversight best practices
Internal controls prevent errors and fraud while ensuring financial reporting accuracy and reliability.
Your control framework for IFRS 17 must address both automated system controls and manual process controls. Gaps in either area create risk.
Segregation of duties prevents any single person from having end-to-end control over critical processes. The person who calculates liabilities shouldn’t be the same person who approves them for financial reporting.
System access controls limit who can view, modify, or approve different data and calculations. Role-based access ensures appropriate people have the right permissions.
Automated controls within your actuarial systems catch obvious errors before results reach financial reporting. These include range checks, reasonability tests, and logical consistency validations.
Manual controls add another layer of review. Experienced actuaries should review results for unusual patterns, material movements, or unexpected outcomes that warrant investigation.
Control testing verifies that controls operate effectively throughout the reporting period. Annual testing isn’t sufficient for critical controls that operate daily or monthly.
Your control documentation should explain what each control is designed to prevent or detect, how it operates, who’s responsible, and what evidence demonstrates its operation.
Deloitte’s 2024 Internal Controls Survey found that 43% of IFRS 17 restatements resulted from control deficiencies rather than technical errors.
Control deficiencies identified during testing must be remediated promptly. Temporary compensating controls may be needed while permanent fixes are developed.
Your external auditors will evaluate your internal controls as part of their audit. Strong controls reduce audit work and costs while increasing confidence in your financial statements.
Validating actuarial models and assumptions
Model validation provides independent assurance that your models work correctly and produce reliable results.
Validation isn’t just running test cases. It’s a comprehensive assessment of model design, implementation, and operation.
Back-testing and sensitivity analysis techniques
Back-testing compares model predictions to actual experience, identifying areas where your models may be biased or inaccurate.
You should regularly compare projected cash flows to actual cash flows for mature cohorts. Persistent differences indicate calibration issues or missing features in your models.
Experience studies analyze mortality, lapse, expense, and other assumptions against actual results. These studies inform assumption updates and identify emerging trends.
Sensitivity analysis quantifies how results change when you vary key assumptions. This helps you understand which assumptions matter most and where additional precision is needed.
You should test both individual assumption sensitivities and combined scenarios. Assumptions interact in complex ways, and combined effects may differ from simple addition of individual impacts.
Stress testing examines extreme scenarios that could significantly affect your financial position. This identifies vulnerabilities and helps you prepare contingency plans.
According to S&P Global’s 2024 Analysis, insurers that conduct comprehensive sensitivity analysis quarterly identify and correct model issues 70% faster than those testing only annually.
Your sensitivity analysis should inform risk disclosure in financial statements. Stakeholders need to understand which assumptions drive your results and how much uncertainty exists.
Independent model validation and peer review
Independence is critical for effective validation. The people who built models can’t objectively validate their own work.
Your validation function should report separately from model development. This organizational separation prevents conflicts of interest and ensures objective assessment.
Validators need appropriate expertise to evaluate model design and implementation. They should understand both actuarial principles and the technical details of your systems.
Validation reports document findings and recommendations clearly. These reports should identify both strengths and weaknesses, with specific suggestions for improvement.
Management responses to validation findings demonstrate accountability. Significant issues should have remediation plans with clear owners and deadlines.
Peer review adds another perspective, particularly for novel approaches or material judgments. Bringing in external experts can provide valuable insights and credibility.
Your model inventory tracks all models used for IFRS 17, their purpose, key assumptions, and validation status. This prevents important models from slipping through the cracks.
Institute of Actuaries 2024 Standards recommend annual validation for critical models, with more frequent validation after significant changes.
Validation frequency should reflect model importance and complexity. Your most critical models warrant more frequent and thorough validation than simpler, immaterial ones.
Documentation and audit-readiness for IFRS 17 reporting
Documentation quality separates smooth audits from painful ones.
You need comprehensive documentation that explains what you did, why you did it, and how stakeholders can understand and rely on your results.
Your methodology documentation describes measurement approaches, model specifications, and calculation processes in sufficient detail for knowledgeable readers to understand and replicate your work.
Assumption documentation covers how you set each assumption, what data supported the decision, what alternatives you considered, and who approved the final choice.
System documentation explains data flows, calculation logic, controls, and reporting processes. This helps others understand how your technology environment supports IFRS 17.
Change documentation tracks all modifications to methodologies, systems, or processes. This creates a clear history of how your implementation evolved over time.
Results documentation explains your financial statement numbers, major movements, and key drivers. This supports management discussion and analysis in your financial reports.
According to Ernst & Young’s 2024 Audit Insights, well-documented IFRS 17 implementations reduce audit hours by 30% compared to poorly documented ones.
Your documentation should anticipate auditor questions. What would you want to know if you were reviewing this work? Addressing those questions proactively saves time.
Regular documentation updates keep pace with implementation evolution. Outdated documentation is worse than no documentation because it misleads users.
For detailed guidance on governance structures and control frameworks, explore best practices in IFRS 17 governance.

Transition Strategies and Implementation Roadmap
Choosing the right transition methodology under IFRS 17
Your transition approach determines how much historical data you need, how long implementation takes, and what your opening balance sheet looks like.
IFRS 17 offers three transition methods, each with different requirements and outcomes. Your choice should balance accuracy, feasibility, and cost.
Full retrospective approach
Full retrospective application gives the most accurate transition results.
You apply IFRS 17 as if it had always been in effect, recalculating all historical contract values using current IFRS 17 principles. This creates perfect comparability with future periods.
You’ll need detailed historical data going back to the inception date of every contract still in force at transition. For long-duration life insurance, this could mean decades of data.
Your actuarial models must be capable of replicating historical cash flows, applying historical assumptions, and calculating historical discount rates and risk adjustments.
Full retrospective application provides clean, comparable financial statements. Investors and analysts prefer this approach because it eliminates transition adjustments.
The challenge is practicability. Many insurers lack historical data in required formats or find the calculation effort exceeds benefits.
IFRS Foundation research indicates that only 35% of insurers applied full retrospective approach for all portfolios, with data availability cited as the primary constraint.
If full retrospective application is impracticable for some contracts, you can use modified retrospective or fair value approaches for those specific portfolios.
Modified retrospective approach
Modified retrospective application simplifies transition when full retrospective isn’t practicable.
You apply IFRS 17 using reasonable and supportable information available without undue cost or effort. The standard provides specific simplifications for different measurement elements.
For CSM calculation, you can use simplified approaches to estimate what the CSM would have been if IFRS 17 had always applied. These simplifications reduce data requirements while maintaining reasonable accuracy.
Discount rates can be based on observable market information at transition rather than requiring reconstruction of historical curves. This significantly reduces complexity.
Risk adjustments at contract inception can be estimated using current methodologies applied to historical conditions, avoiding the need for perfect historical risk quantification.
You document what information was available, what simplifications you applied, and why full retrospective application was impracticable. This transparency helps auditors and users understand your transition numbers.
Modified retrospective results differ from full retrospective, but the difference should be immaterial for most portfolios if you apply simplifications appropriately.
PwC’s 2024 Transition Study found that 48% of insurers used modified retrospective approach for at least some portfolios, typically older life insurance business with limited historical data.
Fair value approach explained
Fair value approach serves as the fallback when neither full nor modified retrospective is practicable.
You measure the liability at transition as if you had purchased the contracts at that date. This creates a fresh start without requiring historical data or calculations.
The CSM at transition equals the difference between the fair value of the contracts and the fulfillment cash flows measured under IFRS 17. This captures any day-one gain or loss in the CSM.
Fair value can be estimated using observable market prices for similar contracts, or through valuation techniques when market prices aren’t available. Most insurers use discounted cash flow models with market-based assumptions.
This approach requires less historical data than retrospective methods. You only need information about contract terms and current market conditions at transition date.
The downside is that fair value measurements may differ significantly from what retrospective application would have produced. This can create transition adjustments that affect comparability.
You need robust documentation explaining how you determined fair value, what market data or valuation techniques you used, and why other transition methods were impracticable.
According to Moody’s 2024 Transition Analysis, 17% of insurers applied fair value approach to at least some portfolios, primarily for acquired businesses with limited pre-acquisition data.
Different transition approaches for different portfolios are acceptable if justified by practicability considerations. Your documentation should explain the rationale for each choice.
Step-by-step actuarial implementation roadmap
Successful IFRS 17 implementation follows a structured roadmap with clear phases and deliverables.
Your roadmap should sequence activities logically, building capabilities progressively rather than trying to do everything simultaneously.
Phase 1 focuses on assessment and planning. You inventory existing contracts, evaluate data availability, identify gaps, and develop your implementation strategy.
During this phase, you make key methodology decisions about measurement models, discount rates, risk adjustments, and transition approaches. These decisions shape everything that follows.
Phase 2 addresses data and systems. You build or enhance actuarial engines, establish data governance frameworks, and implement required integrations.
Parallel processing of historical data for transition calculations happens during this phase. This is often the most time-consuming part of implementation.
Phase 3 covers testing and validation. You run parallel calculations, validate results against expectations, and refine models based on findings.
This phase includes dry runs of financial statement preparation to identify reporting challenges before they affect actual financial statements.
Phase 4 involves implementation and stabilization. You produce actual IFRS 17 financial statements, complete audits, and refine processes based on lessons learned.
Post-implementation optimization continues indefinitely. You enhance efficiency, address emerging issues, and adapt to changing requirements.
Deloitte’s 2024 Implementation Research shows that successful implementations typically span 18-36 months from initiation to first financial statements, depending on portfolio complexity and organizational readiness.
Your roadmap should build in contingency time. Unexpected challenges always arise, and you need buffer to address them without jeopardizing critical deadlines.
Milestones and deliverables during the IFRS 17 transition
Clear milestones help you track progress and identify issues early.
Your milestone framework should include both technical deliverables and governance approvals. Technical work without proper governance approval doesn’t count as complete.
Early milestones include methodology documentation approval, data gap assessment completion, and system vendor selection. These foundational decisions enable subsequent work.
Mid-stage milestones cover model development completion, data migration finish, and integration testing success. These represent significant capability buildout.
Late-stage milestones include parallel run completion, audit readiness assessment, and first financial statement preparation. These demonstrate you’re ready for live implementation.
Each milestone should have defined deliverables, quality criteria, and sign-off requirements. Vague milestones like “model development in progress” don’t provide useful progress tracking.
Your deliverables should include documentation alongside technical work. A completed model without documentation isn’t truly complete.
Risk assessments at each milestone identify issues that could jeopardize subsequent phases. This forward-looking approach prevents small problems from becoming major crises.
According to KPMG’s 2024 Project Management Study, implementations with clear milestone frameworks identified and resolved issues 40% faster than those with less structured approaches.
Regular status reporting against milestones keeps stakeholders informed. When you’re slipping behind, early escalation enables corrective action before deadlines are missed.
Common pitfalls in implementation and how to avoid them
Learning from others’ mistakes helps you avoid repeating them.
The most common pitfall is underestimating implementation complexity. What seems straightforward in theory becomes challenging in practice when dealing with real-world contract diversity.
Many insurers initially treat IFRS 17 as a finance or accounting project. It’s actually a business transformation that requires actuarial leadership and cross-functional collaboration.
Starting too late creates time pressure that forces compromises on quality. Early starts allow time for learning, iteration, and proper testing.
Inadequate investment in systems leads to manual workarounds that don’t scale. What works for 1,000 contracts breaks down when you reach 100,000.
Poor data governance creates issues that compound over time. Data problems discovered late in implementation require expensive remediation and can delay go-live.
Insufficient testing means errors reach financial statements. Robust testing catches issues when they’re easier and cheaper to fix.
Trying to achieve perfection in the first iteration causes delays. A working solution you can enhance beats a perfect solution that never launches.
Inadequate documentation creates problems during audits and when staff turnover occurs. Knowledge that exists only in people’s heads is fragile.
Poor communication with stakeholders leads to surprises and crisis management. Regular, transparent updates build support and enable timely problem-solving.
For regional insights on overcoming implementation challenges, review case studies on IFRS 17 GCC implementation.
Advanced IFRS 17 Actuarial Best Practices
Optimizing level of aggregation and cohort grouping
Level of aggregation decisions significantly affect your results, operational complexity, and ability to explain performance.
IFRS 17 requires grouping contracts into cohorts that are no more than one year wide. Within annual cohorts, you must separate contracts into three buckets based on profitability at inception.
You need to identify contracts that are onerous at inception and group them separately. These contracts are expected to be loss-making and require immediate loss recognition.
Contracts with no significant possibility of becoming onerous form another group. These contracts are solidly profitable with low risk of loss.
All remaining contracts fall into the middle group. They’re expected to be profitable but have material risk of becoming onerous under adverse scenarios.
This three-way split must be determined at inception using information available at that time. You can’t use hindsight to reclassify contracts.
Within these requirements, you have flexibility to create finer groupings. More granular groupings provide better performance tracking but increase operational complexity.
Your grouping strategy should align with how you manage the business. If you analyze profitability by product, channel, or geography, your IFRS 17 groupings should reflect these dimensions.
According to Swiss Re’s 2024 Technical Analysis, insurers using aligned grouping strategies report 25% better ability to explain IFRS 17 results to management and investors.
You need systems that can track each group separately through its entire lifetime. This includes maintaining the group’s CSM, liability for remaining coverage, and liability for incurred claims.
Balancing granularity with manageability requires judgment. Too few groups loses valuable information. Too many groups creates excessive operational burden.
Regular review of grouping effectiveness helps identify opportunities for refinement. You might discover that certain groupings provide little analytical value while consuming significant resources.
Managing actuarial assumptions and sensitivities
Assumption-setting is where actuarial judgment most directly affects your financial statements.
Your assumptions must be current, unbiased, and reflect information available at the measurement date. Historical assumptions don’t meet IFRS 17 requirements.
Mortality, lapse, and expense assumptions
Mortality assumptions drive expected claim costs for life insurance and annuity products.
You should base mortality assumptions on credible experience studies using your own portfolio data. Standard industry tables provide useful benchmarks but may not reflect your specific risk profile.
Mortality improvement trends affect long-duration contracts significantly. Your assumptions should reflect reasonable expectations about future mortality improvements based on medical research and demographic trends.
Different mortality assumptions may apply to different groups of contracts. Smokers versus non-smokers, preferred risk versus standard underwriting, and male versus female all have materially different mortality patterns.
Lapse assumptions affect contract profitability and cash flow timing. Higher lapses reduce the number of future premiums you’ll collect but also reduce future claims you’ll pay.
Your lapse studies should consider economic conditions, contract features, and policyholder characteristics. Lapses often spike when interest rates rise or when contracts come out of surrender charge periods.
Expense assumptions include both direct costs attributable to specific contracts and allocated overhead. You need to project how expenses will change over time due to inflation and efficiency improvements.
Fixed versus variable expense classification matters. Some expenses increase with inflation while others remain stable. Your projections should reflect these differences.
Towers Watson’s 2024 Assumption Study found that expense assumptions show the widest variation across insurers, with allocated overhead methodologies particularly diverse.
Scenario testing and stress analysis
Scenario testing helps you understand assumption uncertainty and its impact on results.
You should regularly test how results change under plausible alternative assumptions. This informs risk disclosure and helps management understand performance drivers.
Your scenarios should cover both favorable and adverse possibilities. Understanding upside potential is as important as quantifying downside risk.
Combined scenarios test interactions between assumptions. Mortality and lapses often correlate during economic stress, and testing them in isolation misses important effects.
Stress testing examines extreme scenarios that could significantly impact your financial position. These help identify vulnerabilities and inform risk management strategies.
Your stress scenarios should include both instantaneous shocks and gradual trend changes. Different stress patterns have different effects on your financial statements.
Documentation of scenario assumptions and results creates transparency. Stakeholders need to understand what you tested and what you learned.
Regular updating of scenarios ensures they remain relevant as conditions change. Scenarios that seemed extreme five years ago may now be baseline expectations.
According to Oliver Wyman’s 2024 Risk Report, insurers conducting comprehensive scenario analysis quarterly make more informed strategic decisions and experience fewer earnings surprises.
Enhancing transparency in actuarial disclosures
IFRS 17 disclosure requirements are extensive, but transparency goes beyond minimum compliance.
Your disclosures should help users understand your business, your risk profile, and your financial performance. Generic boilerplate disclosures add little value.
You need to explain your measurement approaches clearly. Users should understand which models you applied to which contracts and why.
Your discount rate methodology deserves clear explanation. This is one of the most subjective areas of IFRS 17, and users need to understand your choices.
Risk adjustment disclosures must include the confidence level or equivalent information. You should also explain what this means in practical terms.
Analysis of change breakdowns help users understand what drove movements in your insurance liabilities. Clear attribution to new business, existing business changes, and assumption updates provides valuable insights.
Your disclosures should highlight areas of significant judgment. Where did you make material choices that other insurers might have made differently?
Sensitivity disclosures quantify the impact of changing key assumptions. Users need this information to understand the uncertainty in your estimates.
Reconciliations between opening and closing balances for CSM, liability components, and other key metrics provide transparency about how positions evolved.
Financial Reporting Council 2024 Guidance emphasizes that high-quality disclosures use plain language, avoid unnecessary complexity, and focus on information that actually influences user decisions.
Your disclosures should tell a coherent story about your business performance. Each piece of disclosure should connect to others, creating comprehensive understanding.
Regular review of disclosure effectiveness helps identify improvements. What questions do analysts ask repeatedly? Those gaps suggest disclosure enhancements.
Technology, Tools, and Automation for IFRS 17
Automating calculations under IFRS 17 actuarial best practices
Manual calculations don’t scale under IFRS 17’s detailed requirements.
You need automation that handles routine calculations accurately while freeing actuaries to focus on judgment, analysis, and insight generation.
Your automation should cover data extraction, transformation, and loading. Manual data manipulation creates errors and consumes time better spent on analysis.
Calculation engines must process contract-level or cohort-level measurements efficiently. Processing times measured in days create bottlenecks that prevent timely reporting.
Automated validation catches errors immediately. Waiting until month-end to discover calculation problems delays your close process.
Your automation should generate standard reports and analyses without manual intervention. Recreating the same charts and tables each period wastes resources.
Integration between systems eliminates manual data transfer. Each manual handoff introduces error risk and delays.
According to Accenture’s 2024 Automation Study, insurers with high automation levels complete IFRS 17 reporting 55% faster than those relying heavily on manual processes.
Version control for automated processes ensures reproducibility. You need to know exactly which calculation version produced each set of results.
Exception handling procedures address situations where automation encounters errors. Clear escalation paths ensure problems get resolved quickly.
Your automation strategy should include regular reviews of efficiency gains. Where are manual interventions still occurring? These indicate automation opportunities.
Selecting the right actuarial software and IFRS 17 tools
Software selection significantly affects implementation success and ongoing operational efficiency.
You’ll choose between building custom solutions, enhancing existing systems, or implementing vendor packages. Each approach has tradeoffs.
Key features to evaluate before implementation
Your evaluation should start with functional requirements. Does the IFRS 17 software handle all three measurement models? Can it manage your contract types and features?
Calculation performance matters enormously. Software that takes days to run prevents timely reporting and limits your ability to perform scenario analysis.
Data management capabilities determine whether you can handle IFRS 17’s volume and granularity requirements. Weak data management creates ongoing operational challenges.
Reporting flexibility affects your ability to generate required disclosures and management information. Rigid reporting forces manual workarounds.
Your software should support assumption updates efficiently. Recalibrating assumptions is a regular activity that shouldn’t require massive rework.
Integration capabilities determine how well the software fits your technology ecosystem. Isolated systems create data synchronization challenges.
User interface quality affects productivity and error rates. Unintuitive interfaces slow work and increase mistakes.
Vendor support and training availability impact your implementation timeline and ongoing success. Good vendors provide comprehensive support throughout your journey.
Integration with financial reporting platforms
Your actuarial systems must feed seamlessly into financial consolidation and reporting platforms.
Integration architecture should support automated data feeds with built-in validation. Manual file transfers introduce delays and errors.
Your systems should provide audit trails showing how actuarial calculations became financial statement numbers. This transparency facilitates audit and review processes.
Reconciliation capabilities help identify discrepancies between actuarial and financial data quickly. Early detection prevents small issues from becoming significant problems.
Your integration should support multiple reporting frameworks simultaneously. You need IFRS 17, local GAAP, and regulatory reporting without maintaining separate systems.
Real-time or near-real-time integration enables continuous close processes. Waiting until month-end to integrate data creates time pressure and limits ability to address issues.
Your platform should handle complex ownership structures and consolidation requirements. Group-level reporting often involves intricate relationships between legal entities.
According to Gartner’s 2024 Integration Research, API-based integration architectures reduce integration maintenance costs by 40% compared to point-to-point batch transfers.
For comprehensive guidance on system selection, explore resources on selecting the right IFRS 17 compliance system.
Using IFRS 17 actuarial calculators for decision-making
Actuarial calculators provide quick insights without full model runs.
These tools let you estimate the impact of business decisions, assumption changes, or market movements rapidly. This supports faster, more informed decision-making.
Your calculator should handle common what-if scenarios. What happens if we change pricing? How does mortality assumption impact profit? What’s the effect of rising interest rates?
Calculator results should be sufficiently accurate for decision-making while being fast enough for interactive use. Perfect precision isn’t necessary when comparing alternatives.
Documentation of calculator methodologies ensures users understand limitations. Calculators make simplifying assumptions that affect accuracy in certain situations.
Regular validation against full models maintains calculator credibility. Significant divergences indicate recalibration needs.
Your calculator should be accessible to appropriate users beyond the actuarial team. Pricing actuaries, product managers, and business leaders benefit from self-service analytical capabilities.
Training on calculator use and limitations prevents misapplication. Users need to understand when calculator results are reliable versus when full models are necessary.
According to Willis Towers Watson’s 2024 Tools Survey, insurers with well-designed calculators make strategic decisions 30% faster than those requiring full model runs for every analysis.
For practical calculator tools and templates, visit resources on IFRS 17 calculator solutions.
Leveraging predictive analytics in actuarial modeling
Predictive analytics enhances traditional actuarial modeling with machine learning and advanced statistical techniques.
These approaches can improve assumption-setting, identify emerging trends, and enhance risk quantification.
Machine learning models can predict lapse behavior more accurately by considering hundreds of variables simultaneously. Traditional models typically use only a handful of factors.
Predictive models for mortality can identify subtle risk indicators that traditional underwriting misses. This improves risk selection and pricing accuracy.
Your predictive models should complement rather than replace actuarial judgment. Models identify patterns, but actuaries interpret results and determine appropriate applications.
Validation of predictive models requires specialized expertise. You need to understand both actuarial principles and data science techniques to evaluate model quality.
Regulatory acceptance of predictive analytics varies by jurisdiction. Some regulators embrace advanced techniques while others prefer traditional approaches.
Explainability becomes important when using complex models for financial reporting. You need to explain how models work and why results are reasonable.
Your predictive analytics should integrate with existing actuarial processes smoothly. Siloed analytics that don’t feed into production systems provide limited value.
McKinsey’s 2024 Analytics Report found that insurers successfully applying predictive analytics to IFRS 17 processes reduce assumption volatility by 20% while improving accuracy.
Collaboration and Strategic Value Creation
Strengthening collaboration between actuarial, finance, and IT teams
IFRS 17 requires unprecedented collaboration across traditionally separate functions.
Actuaries provide technical expertise on measurement and assumptions. Finance teams ensure proper accounting treatment and financial statement presentation. IT builds and maintains enabling systems.
Breaking down silos starts with shared objectives. All three functions should work toward common goals rather than optimizing their individual domains.
Regular cross-functional meetings create opportunities for alignment. These shouldn’t be status updates but actual working sessions that solve problems collaboratively.
Your teams need shared understanding of each other’s languages and priorities. Actuaries should understand accounting principles. Finance teams need basic actuarial concepts. IT must grasp both.
Joint training sessions build this shared knowledge base. When everyone understands the full picture, collaboration becomes more effective.
Clear interfaces between functions reduce friction. Who’s responsible for what? Where do handoffs occur? What quality standards apply?
Your collaboration should extend beyond IFRS 17 implementation. The relationships you build benefit pricing, risk management, and strategic planning.
According to Deloitte’s 2024 Collaboration Study, insurers with strong cross-functional collaboration report 45% higher satisfaction with IFRS 17 results than those with siloed organizations.
Shared performance metrics encourage collaboration. When actuarial, finance, and IT share accountability for IFRS 17 success, they naturally work together more effectively.
Aligning actuarial insights with corporate strategy
IFRS 17 elevates actuaries from technical specialists to strategic business partners.
Your actuarial insights inform pricing decisions, product design, risk appetite, and capital allocation. This strategic role requires communication skills alongside technical expertise.
You need to translate technical results into business implications. What does a 10% increase in CSM mean for the company’s growth trajectory? How should management respond to rising risk adjustments?
Your analysis should connect IFRS 17 metrics to business performance indicators that executives track. Link CSM growth to new business value. Relate risk adjustments to economic capital requirements.
Strategic planning processes should incorporate actuarial perspectives early. Waiting until decisions are made to provide actuarial input misses opportunities to shape strategy.
Your insights can identify profitable growth opportunities and unprofitable business to exit. IFRS 17’s granular measurement reveals performance patterns that aggregate metrics hide.
Capital allocation decisions benefit from actuarial analysis of returns on different business lines. You can quantify which segments generate value and which destroy it.
M&A evaluation requires actuarial assessment of target companies’ contract values and risk profiles. Your IFRS 17 expertise directly supports deal decisions.
Regular communication of insights to senior management builds your strategic influence. Don’t wait to be asked – proactively share analysis that informs key decisions.
Enhancing risk management and capital allocation
IFRS 17 provides rich information for risk management and capital allocation decisions.
Your IFRS 17 calculations already quantify many risks. The risk adjustment explicitly measures compensation for uncertainty. Sensitivity analysis shows exposure to assumption changes.
Integration between IFRS 17 and risk management systems creates efficiency. Shared assumptions and models reduce duplication while improving consistency.
Your IFRS 17 results inform regulatory capital requirements. Many solvency frameworks reference IFRS-like measurements, making your work directly relevant to capital planning.
Economic capital models benefit from IFRS 17 data and methodologies. The discipline IFRS 17 imposes on assumption-setting improves economic capital quality.
Capital allocation across business units should consider IFRS 17 profitability metrics. CSM growth and release patterns indicate which units generate sustainable value.
Your risk-return analysis becomes more sophisticated with IFRS 17 data. You can quantify returns more accurately while explicitly considering risk through the risk adjustment.
Stress testing and scenario analysis capabilities you built for IFRS 17 support broader risk management needs. These tools provide insights beyond financial reporting.
According to S&P Global’s 2024 Risk Assessment, insurers integrating IFRS 17 with risk management frameworks demonstrate stronger risk-adjusted performance than those treating them separately.
Expanding actuarial roles beyond regulatory compliance
IFRS 17 implementation built capabilities that extend far beyond financial reporting compliance.
Your enhanced data infrastructure supports better pricing, improved claims management, and more effective customer analytics.
The actuarial skills developed during implementation apply to product development, distribution strategy, and customer experience optimization.
Your modeling capabilities enable more sophisticated scenario planning and strategic analysis. You can evaluate business initiatives with greater precision than before.
Career opportunities for actuaries expanded significantly. CFOs now recognize actuarial teams as strategic assets rather than cost centers.
Your role in explaining financial performance to investors and analysts grows. Actuaries who can communicate effectively become invaluable to investor relations.
Integration with other analytical functions creates opportunities. Actuaries work alongside data scientists, economists, and strategic planners on cross-functional initiatives.
The technical rigor IFRS 17 demands raises professional standards across the actuarial profession. This benefits individuals and strengthens the profession overall.
Society of Actuaries 2024 Career Survey found that actuaries involved in IFRS 17 implementation report 35% higher career satisfaction and 28% faster career progression than peers in other specializations.
Don’t limit yourself to financial reporting. Apply your IFRS 17 expertise to broader business challenges where actuarial insights create value.

Industry Insights and Case Studies
Key lessons from successful IFRS 17 actuarial implementations
Success patterns emerge when analyzing insurers who implemented IFRS 17 effectively.
Early starters consistently performed better than late starters. Beginning 3-4 years before effective date allowed time for learning, testing, and refinement.
Executive sponsorship made critical differences. Implementations led from the C-suite with board oversight succeeded more often than those delegated to middle management.
Investment in systems paid dividends. Insurers who built robust technology platforms reported smoother ongoing operations than those who minimized initial spending.
Cross-functional teams outperformed siloed organizations. Breaking down barriers between actuarial, finance, and IT enabled faster problem-solving and better solutions.
Clear communication with auditors early and often prevented surprises. Insurers who involved auditors in methodology decisions avoided costly late-stage changes.
Phased approaches allowed learning from early phases to inform later work. Big-bang implementations created overwhelming complexity.
Focus on materiality prevented analysis paralysis. Not every detail required perfection – understanding what matters most enabled efficient resource allocation.
According to EY’s 2024 Success Factors Analysis, insurers exhibiting these success patterns completed implementation 40% faster with 30% lower costs than average.
Continuous improvement mindset separated good implementations from great ones. The best insurers didn’t stop at go-live but continuously refined processes and enhanced capabilities.
Benchmarking best practices from leading insurers
Leading insurers share common characteristics in their IFRS 17 approaches.
Sophisticated discount rate methodologies balance theoretical rigor with practical implementation. Top performers document their approaches comprehensively and apply them consistently.
Risk adjustment practices at leading insurers demonstrate clear links to economic capital and risk management frameworks. This integration improves consistency and credibility.
Data governance at top-tier insurers features clear ownership, comprehensive documentation, and automated quality controls. They treat data as a strategic asset.
System architecture emphasizes integration and automation. Leading insurers minimize manual processes and create seamless data flows across functions.
Assumption-setting processes involve multi-disciplinary committees with clear governance and documentation requirements. This ensures appropriate oversight while preventing bottlenecks.
Communication strategies at successful insurers emphasize transparency and plain language. They help stakeholders understand results rather than overwhelming them with technical jargon.
Continuous improvement programs systematically identify and implement enhancements. Leading insurers don’t become complacent after initial implementation.
Emerging actuarial trends in a post-IFRS 17 environment
The insurance industry continues evolving as IFRS 17 matures and new challenges emerge.
Climate risk integration represents the next frontier. Actuaries increasingly incorporate climate scenarios into assumption-setting and risk adjustments.
Artificial intelligence and machine learning enhance traditional actuarial methods. These technologies improve assumption accuracy and identify patterns humans miss.
Real-time reporting capabilities are emerging. Some insurers now produce IFRS 17 estimates monthly or even more frequently, enabling faster business decisions.
Simplification initiatives address unnecessary complexity that crept into initial implementations. Insurers identify areas where precision doesn’t materially affect results and adopt simpler approaches.
The forthcoming IFRS 18 standard will require reconciliation of alternative performance measures. Actuaries play key roles in developing these reconciliations and explaining adjustments.
Regional harmonization progresses as jurisdictions align solvency frameworks with IFRS 17 principles. This creates opportunities for consistent global practices.
Talent development challenges persist. The actuarial profession needs professionals combining traditional skills with technology expertise and business acumen.
Moody’s 2024 Industry Outlook predicts continued IFRS 17 maturation over the next 3-5 years, with emphasis shifting from implementation to optimization and strategic value extraction.
ESG considerations increasingly influence actuarial assumptions and risk adjustments. Actuaries quantify sustainability risks and their financial statement impacts.
IFRS 17 Actuarial Best Practices – FAQs
What are the main actuarial challenges under IFRS 17?
Data volume and complexity top the list of actuarial challenges.
You need contract-level detail spanning decades for long-duration business. Legacy systems often didn’t capture or retain this information in usable formats.
System performance becomes critical when processing millions of contracts monthly. Calculation engines that worked fine for annual valuations struggle with monthly reporting requirements.
Assumption-setting requires significantly more granularity than IFRS 4. You can’t use aggregate assumptions across diverse contract types.
Resource constraints plague many implementations. Finding actuaries with both IFRS 17 expertise and practical implementation experience is difficult.
Audit requirements intensified dramatically. You need comprehensive documentation, robust controls, and clear governance that may not have existed previously.
How do insurers select the right measurement model?
Model selection depends primarily on contract characteristics and duration.
PAA applies to short-duration contracts where simplified measurement produces results not materially different from GMM. You’ll typically use PAA for property and casualty business with coverage periods under one year.
VFA applies to contracts with direct participation features where policyholders share substantially in underlying item returns. Unit-linked and participating life insurance often qualify for VFA.
GMM serves as the default for everything else. Most traditional life insurance, long-term health insurance, and longer-duration property and casualty contracts use GMM.
You need to test whether simplified approaches produce materially different results than GMM. This testing requires judgment about what constitutes material difference.
Your model selection should consider not just technical compliance but also operational efficiency and ability to explain results to stakeholders.
For additional context, review common misconceptions in IFRS 17 myths to ensure your model selection avoids typical misunderstandings.
What’s the most effective risk adjustment approach?
No single risk adjustment approach works best for all insurers.
Confidence level methods are most common, with insurers calculating the difference between best estimate liabilities and a specified percentile (typically 70th-90th).
Cost-of-capital approaches calculate the present value of the cost of holding regulatory or economic capital to support non-financial risks.
Your approach should align with how you manage risk internally. Disconnects between IFRS 17 risk adjustments and internal risk metrics create confusion.
Calibration to desired outcomes is acceptable provided you can demonstrate consistency with IFRS 17 principles. Many insurers calibrate to achieve specific confidence levels or coverage ratios.
Your risk adjustment should be stable and explainable. Significant volatility without clear drivers suggests calibration issues.
Documentation quality matters enormously. Auditors scrutinize risk adjustment methodologies carefully, and you need clear support for your approach.
How can automation improve actuarial reporting?
Automation transforms IFRS 17 from a painful monthly process to a streamlined operation.
Automated data pipelines eliminate manual extraction, transformation, and loading. This reduces errors and accelerates reporting timelines.
Calculation automation ensures consistent application of methodologies across all contracts. Manual calculations inevitably introduce inconsistencies.
Automated validation catches errors immediately rather than during month-end reviews. Early detection enables faster resolution.
Reporting automation generates standard analyses and disclosures without manual intervention. This frees actuaries for value-added analysis.
Integration automation seamlessly transfers data between systems. Manual file transfers create bottlenecks and error opportunities.
What training do actuarial teams need for IFRS 17 success?
Training needs span technical knowledge, systems proficiency, and soft skills.
Technical training covers IFRS 17 principles, measurement models, and specific calculation requirements. This foundation enables sound technical work.
Systems training ensures actuaries can effectively use IFRS 17 platforms. Sophisticated systems deliver value only when users understand their capabilities.
Accounting training helps actuaries understand financial statement presentation and accounting principles. This improves collaboration with finance teams.
Communication training develops skills to explain complex concepts to non-technical audiences. Actuaries must translate technical results into business insights.
Project management training supports implementation efforts. Actuaries often lead work streams requiring these skills.
Regular refresher training maintains knowledge as standards evolve and organizational capabilities mature.
To understand the broader relationship between different reporting standards, explore connections between IFRS 17 vs IFRS 9 as integrated training often covers both.
As we start our project, can an IFRS 17 outsourcing service help us choose the correct measurement approach (GMM, PAA, VFA) for our portfolios?
Selecting the right measurement model is one of the most critical, early decisions in your IFRS 17 project. Get this wrong, and your future financial results could be distorted. This choice directly impacts your profitability presentation and your financial planning. Yes, an IFRS 17 outsourcing service should be your first call for strategic guidance.
Our team performs a portfolio assessment early in the process. We compare the General Measurement Model (GMM), the Premium Allocation Approach (PAA), and the Variable Fee Approach (VFA) against your specific contract types. We then give you a blueprint that explains which model you should apply to each group of contracts. This foundational work sets your entire implementation project on the right footing.
Mastering IFRS 17 Actuarial Best Practices for Sustainable Success
IFRS 17 actuarial best practices represent more than technical compliance requirements.
They’re the foundation for transparent, credible financial reporting that builds stakeholder confidence. Your implementation quality directly affects how investors, regulators, and rating agencies view your organization.
The journey from initial implementation to maturity continues for several years. Even insurers who successfully completed first financial statements find opportunities for refinement and enhancement.
Success requires balancing technical rigor with practical constraints. Perfect precision isn’t achievable or necessary. Material accuracy with clear documentation and robust governance delivers stakeholder value.
Your focus should shift from implementation to optimization. How can you enhance efficiency? Where can automation reduce manual effort? What insights can you extract beyond compliance requirements?
The actuarial profession transformed through IFRS 17. You’re no longer back-office technicians but strategic business partners influencing pricing, capital allocation, and corporate strategy.
This expanded role brings opportunities and responsibilities. You need technical excellence alongside communication skills, business acumen, and strategic thinking.
Investment in IFRS 17 capabilities pays dividends beyond financial reporting. Better data, sophisticated models, and disciplined processes improve decision-making across your organization.
The insurers who view IFRS 17 as business transformation rather than accounting compliance extract maximum value. They build capabilities that strengthen competitive positions and create sustainable advantages.
Your commitment to IFRS 17 actuarial best practices positions you for long-term success. The foundation you built supports adaptation as standards evolve and business needs change.
Ready to elevate your IFRS 17 implementation and unlock strategic value? Prima Consulting brings deep actuarial expertise and proven implementation experience to help you build robust, efficient, and audit-ready IFRS 17 frameworks.
Our specialists work alongside your team to optimize processes, enhance governance, and transform compliance into competitive advantage. Contact us today to discover how we can support your IFRS 17 journey.